Examining voting turnout is the theme for this week’s blog, and previous turnout data will be utilized in predicting elections. At first glance, turnout is not an obvious predicting variable when it comes to forecasting elections. After all, one might believe increased turnout in a district, for example, just means that there will be the same vote share, and a proportional increase in each party’s total vote count. However, it could be an important factor in toss-up districts.
Speaker of the House Nancy Pelosi seems to believe in the notion that Democrats benefit from higher voter turnout, stating in October 2022, “The public is with the Democrats,” indicating her belief that more voters fall in line with her party. This is a phenomenon that I will explore in this blog. First I will examine how increased district turnout affects the Democratic vote share, then I will display it in tandem with incumbency effects. Lastly, I will analyze turnout in the context of the most recent midterm elections in 2018. All this analysis will feed into this week’s updated election forecast, with using 2018 turnout levels as stand-in data for 2022 (until I gather better/more accurate and predictive turnout data for 2022).
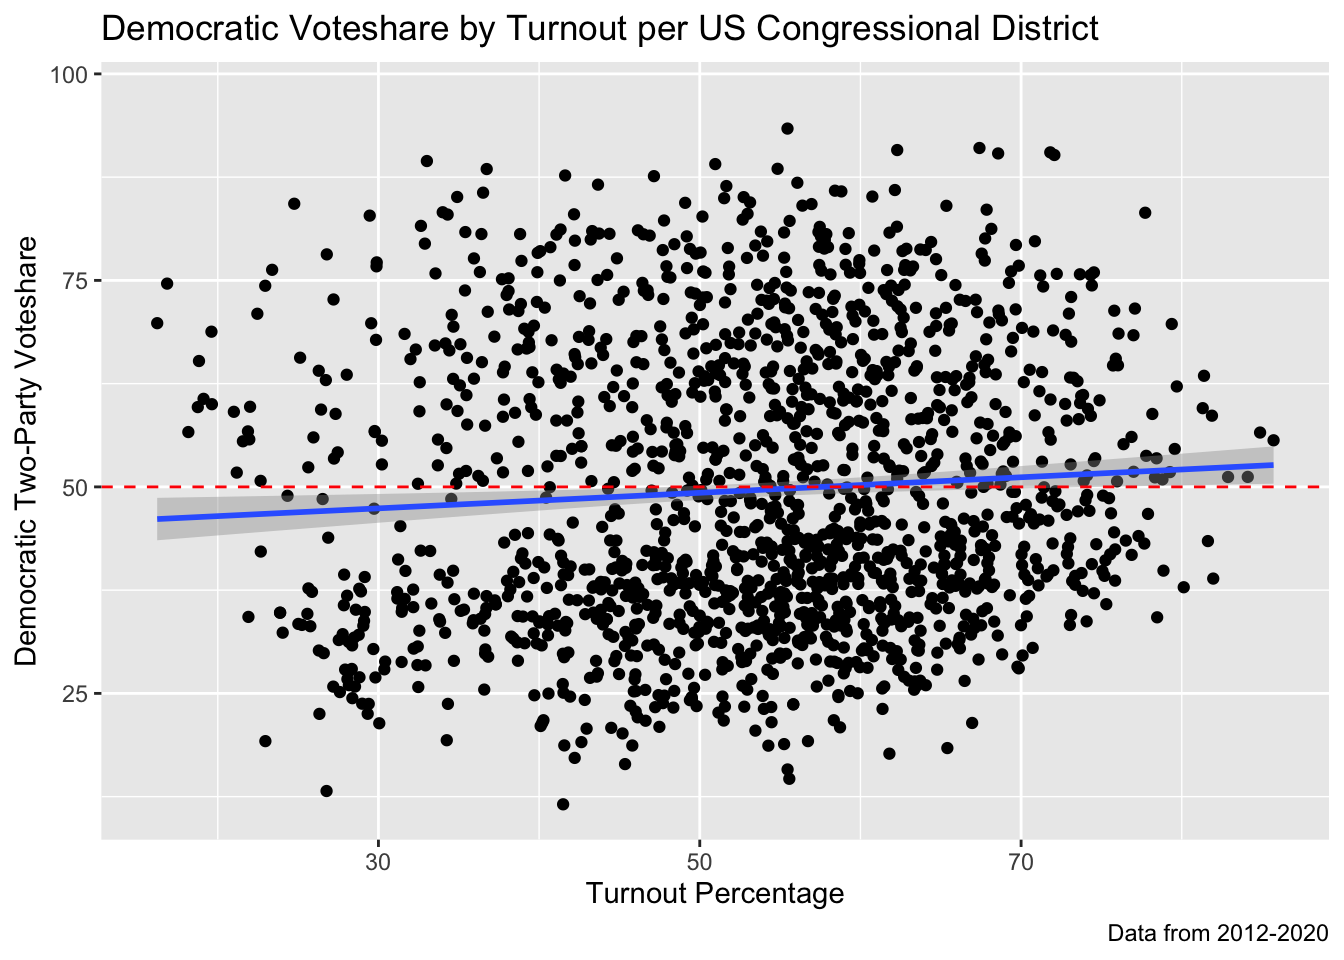
Is Speaker Pelosi Right
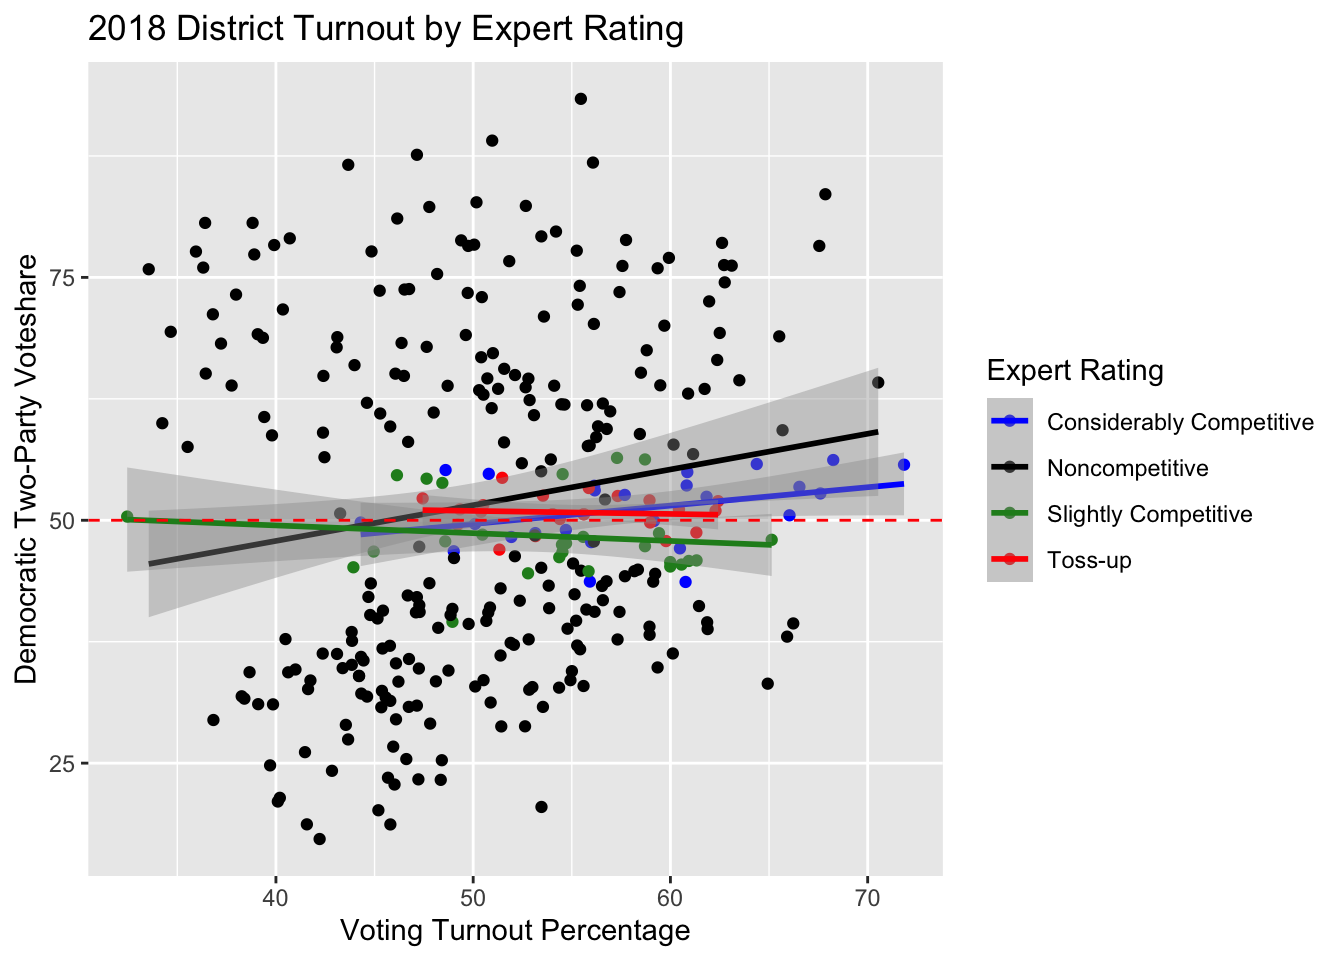
After plotting how turnout data on the congressional district level, it is evident that increased turnout has minimal benefits for the Democratic candidate. Our plot reveals that the relationship between the variables is not strong, let alone even related to an extent. This leads me to believe the notion that increased turnout does not benefit the Democrats, at least to the extent that Speaker Pelosi stated (as it almost being a campaign stratgey in and of itself).
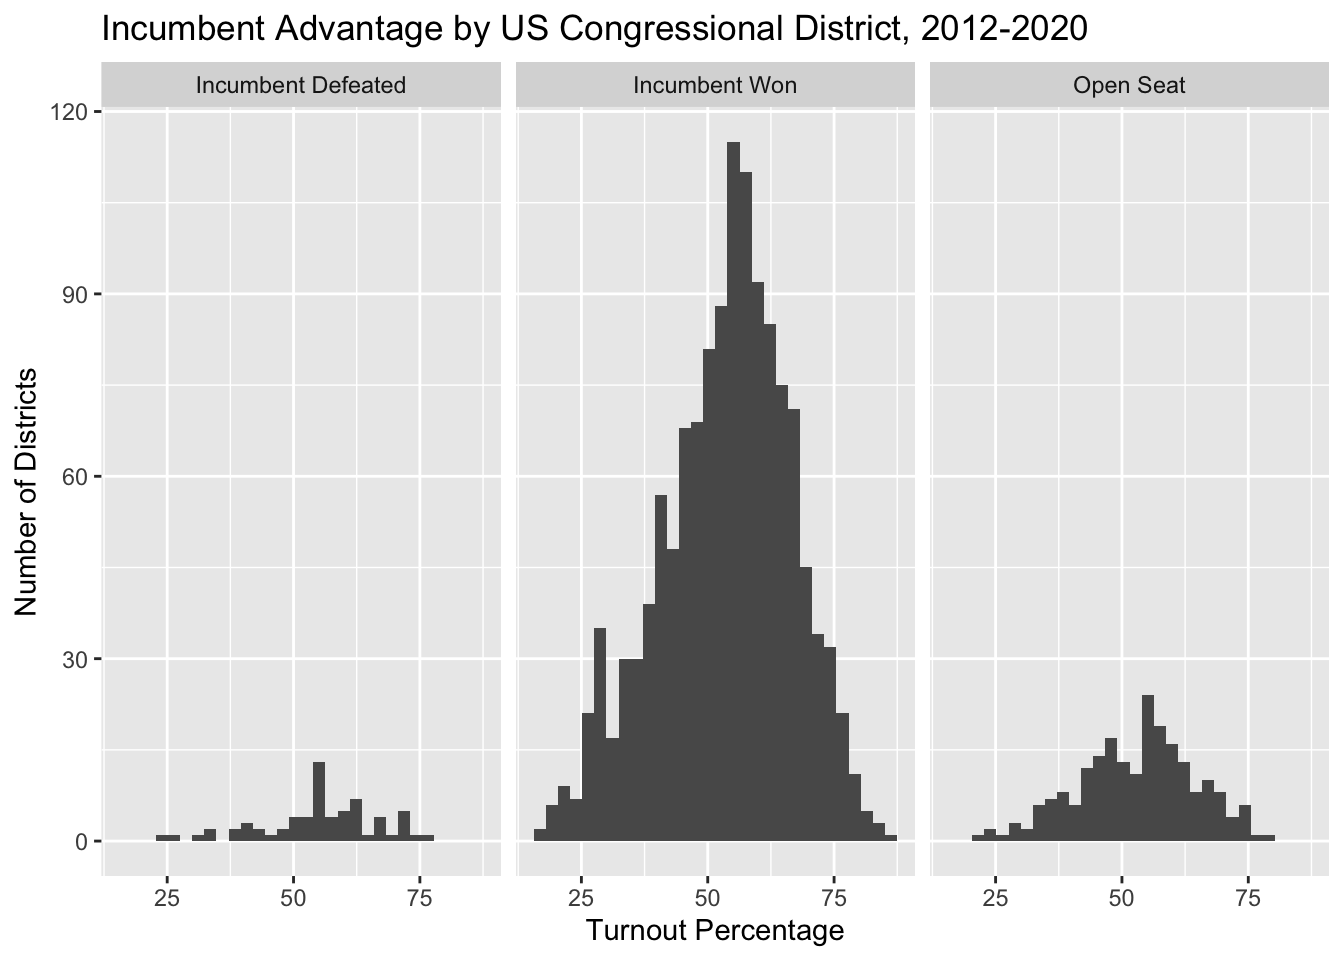
The Incumbency Advantage Revisited
After plotting the relationship between turnout and the Democratic two-party vote share on a congressional district (and hardly seeing any relationship), I decided to see how this looks on a more granular level, highlighting how turnout affects incumbents and challengers alike. This resulted from the notion that increased turnout may indeed benefit an incumbent’s challenger, as evidenced by Professor Ryan D. Enos in Gov 1347 lecture. He displayed how 2018 congressional challengers who won boasted higher median voter turnout than an incumbent winner.
After visualizing this across congressional elections from 2012-2020, we see how each scenario is centered around the same turnout level of 54%, which refutes Professor Ryan D. Enos’ point. He examined one specific cycle, however, which may include other factors not seen through this analysis: referendum on the incumbent president, “increased get out the vote” efforts, etc.
What is most poignant in this visualization is just how rare an incumbent loses. This incumbency advantage is stark and inclines me to include this variable in this week’s forecast.
Is Turnout Correlated with Close Elections?
In previous blogs, it became evident that many districts each cycle, in fact, are noncompetitive, meaning a candidate is nearly guaranteed to win the election by common knowledge. However, several remain extremely contested, and money is flooded into these districts to support “get out the vote” ground campaigning and media advertising over the airwaves.
What I seek to examine is whether a district that is seen to be competitive ensues in higher turnout. After all, scholars Ryan D. Enos and Anthony Fowler find that turnout in states highly targeted by ground campaigning on average increased by 7-8% in the 2012 presidential election.
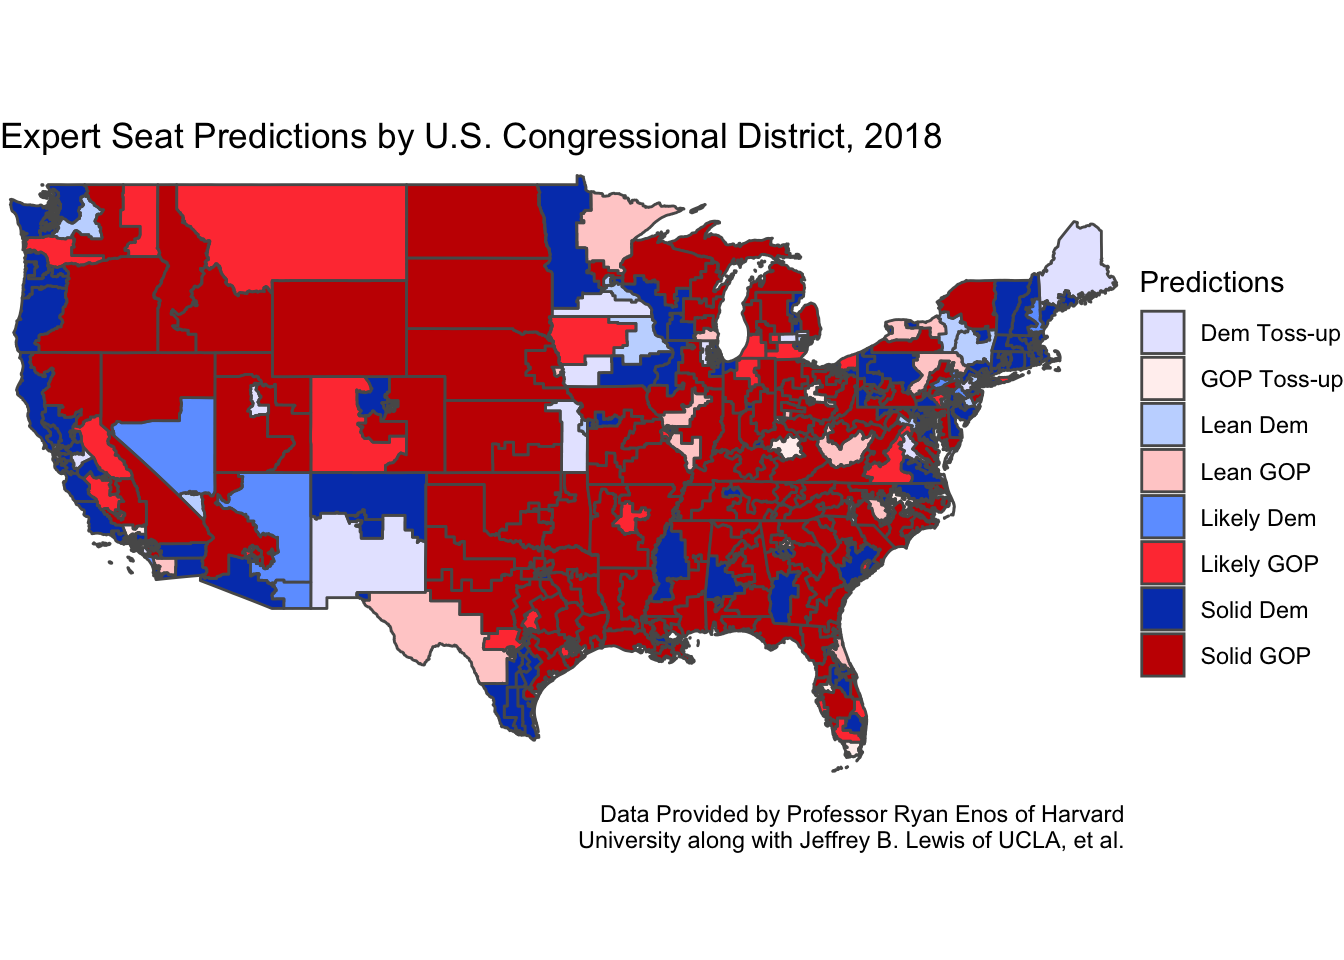
The map below displays the seat share predicted by the “experts” in the 2018 cycle. These predictions hinge on a variety of factors, culminating into their overall district “rating” that provides a probability of the favored party’s chances at winning, as detailed by Nate Silver of FiveThirtyEight. The categories “toss-up, lean, likely, and solid” go in order of increasing probability to win, respectively, with a toss-up signifying a race that is close to 50/50.
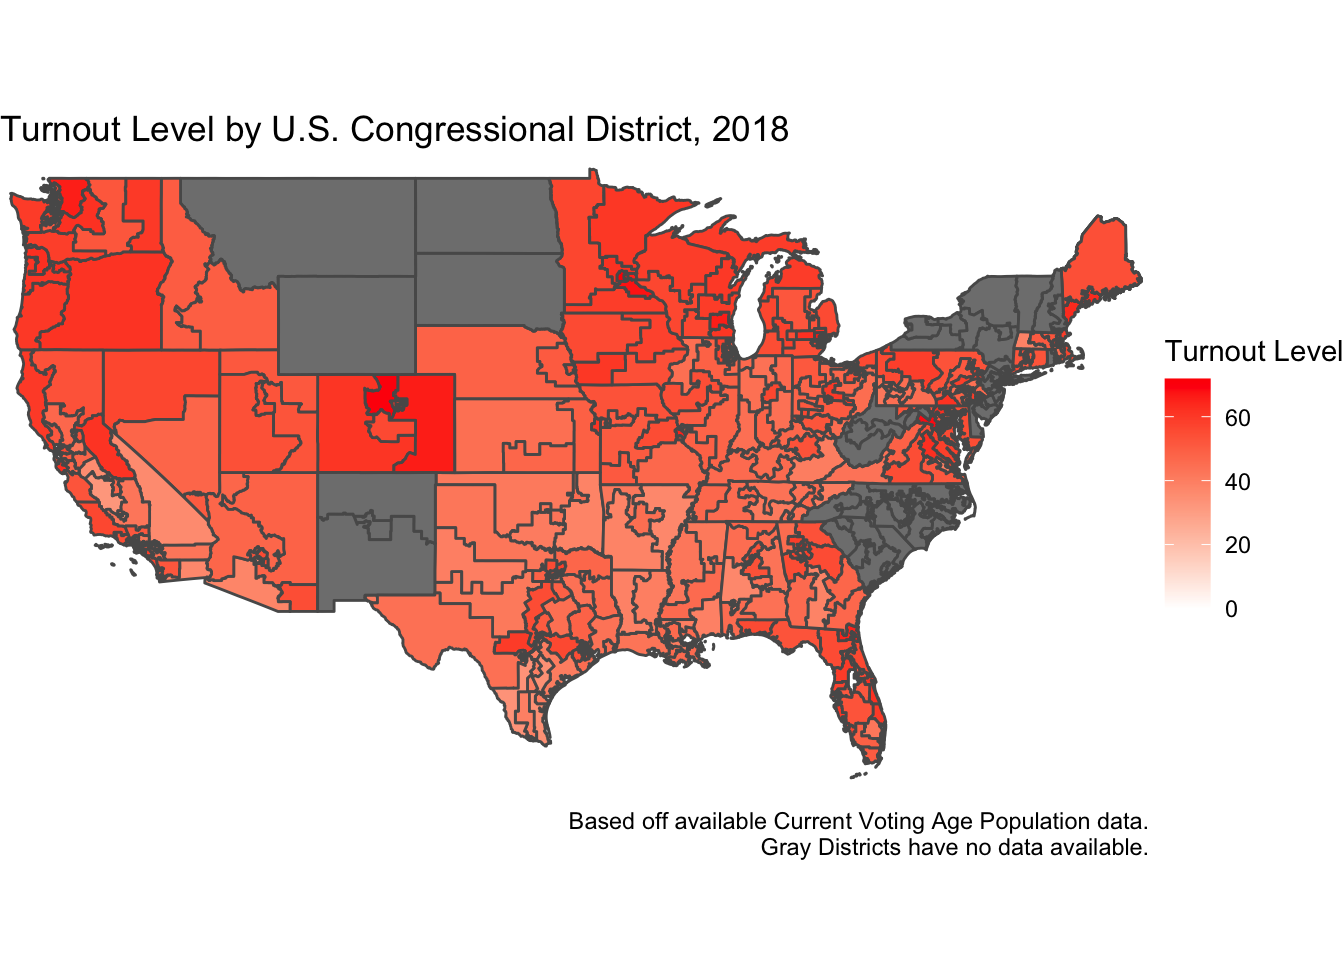
Examining Turnout in the Most Recent Midterm Elections
Now, as we examine turnout across districts in the 2018 cycle, the map below displays results that are unconvincing of how much turnout is correlated with races predicted to be competitive. There is no indication that predicted closer races experienced higher voter turnout, especially when you look at noncompetitive (solid R/Solid D) districts in Oregon and Colorado boasting higher turnout levels and many toss-up races boasting lower turnout.
The plot below further compares how Democratic vote share correlates with voter turnout, according to different expert ratings. And potentially to Speaker Nancy Pelosi’s surprise, increased turnout in the more competitive 2018 races actually hurt Democrats.
The map above and the plot below continue to sour my idea that turnout can become a reliable predictor variable in election forecasts. However, I believe it is worth examining in a model to see if the additional predictor variable improves my forecast (because my model has taken a turn for the worse in recent weeks).
Small Note on My Models Below
Due to statistical limitations in a model, I am required to create two of them: One where the incumbency district is included with all other variables, and another model where it is not included. This is because my turnout data only goes back to 2012, forcing each district to have a max 5 observations (2012 - 2020). This is significant because some congressmen and congresswomen have stayed in office all throughout that time period, preventing any variation in the incumbency variable over that time period (and thus the model is not able to see how a change in incumbency affects the resulting Democratic vote share). Therefore, my model with the incumbency variable included contains districts that have experienced a change in their representative, and the other model without an incumbency variable contains districts where the elected representative has not left office.
Democratic Vote Share Results by Congressional District With Incumbency Variable Included
This model below contains districts that have experienced a change in who represents the district. Small note: The prediction table contains four predicted values per district, all being the same (limitation of setting up the model). This model include four variables: the real disposable change percentage from April-November of an election year, the Democrats’ averaged generic ballot polling margin, turnout percentage, the average expert rating per district, and an incumbency variable.
Unfortunately, this model seems to not have improved from last week’s, obtaining once again predictions above 100% (which are not possible). Also, the resulting R-squared values worry me, as almost all have values of 1. It is suspicious that my model is theoretically explaining 100% of the variance in the data. I believe this phenomenon to be a function of the fact that each district is working off at most 5 observations.
##           state district                                   pred
## 1       Arizona        1 48.92401, 48.92401, 48.92401, 48.92401
## 2       Arizona        2 45.70932, 45.70932, 45.70932, 45.70932
## 3    California       21 31.40359, 31.40359, 31.40359, 31.40359
## 4    California       26     52.4769, 52.4769, 52.4769, 52.4769
## 5    California       49 63.09787, 63.09787, 63.09787, 63.09787
## 6      Colorado        3 43.93991, 43.93991, 43.93991, 43.93991
## 7   Connecticut        5 51.69077, 51.69077, 51.69077, 51.69077
## 8       Florida        2 51.76711, 51.76711, 51.76711, 51.76711
## 9       Florida       27     48.8008, 48.8008, 48.8008, 48.8008
## 10     Illinois       13 45.26855, 45.26855, 45.26855, 45.26855
## 11         Iowa        1 43.31683, 43.31683, 43.31683, 43.31683
## 12         Iowa        2     40.9123, 40.9123, 40.9123, 40.9123
## 13         Iowa        3 39.26067, 39.26067, 39.26067, 39.26067
## 14        Maine        2 33.65056, 33.65056, 33.65056, 33.65056
## 15     Michigan       11 48.14957, 48.14957, 48.14957, 48.14957
## 16     Michigan        3 47.98347, 47.98347, 47.98347, 47.98347
## 17     Michigan        8 49.43809, 49.43809, 49.43809, 49.43809
## 18    Minnesota        1 47.75468, 47.75468, 47.75468, 47.75468
## 19    Minnesota        2 44.56922, 44.56922, 44.56922, 44.56922
## 20    Minnesota        8 48.89282, 48.89282, 48.89282, 48.89282
## 21       Nevada        3 43.30081, 43.30081, 43.30081, 43.30081
## 22       Nevada        4 68.26469, 68.26469, 68.26469, 68.26469
## 23 Pennsylvania        6 45.69628, 45.69628, 45.69628, 45.69628
## 24 Pennsylvania        7 46.44526, 46.44526, 46.44526, 46.44526
## 25 Pennsylvania        8 53.17701, 53.17701, 53.17701, 53.17701
## 26        Texas       23 56.68317, 56.68317, 56.68317, 56.68317
## 27     Virginia       10 41.10149, 41.10149, 41.10149, 41.10149
## 28     Virginia        5 180.8803, 180.8803, 180.8803, 180.8803
## 29   Washington        8 52.44094, 52.44094, 52.44094, 52.44094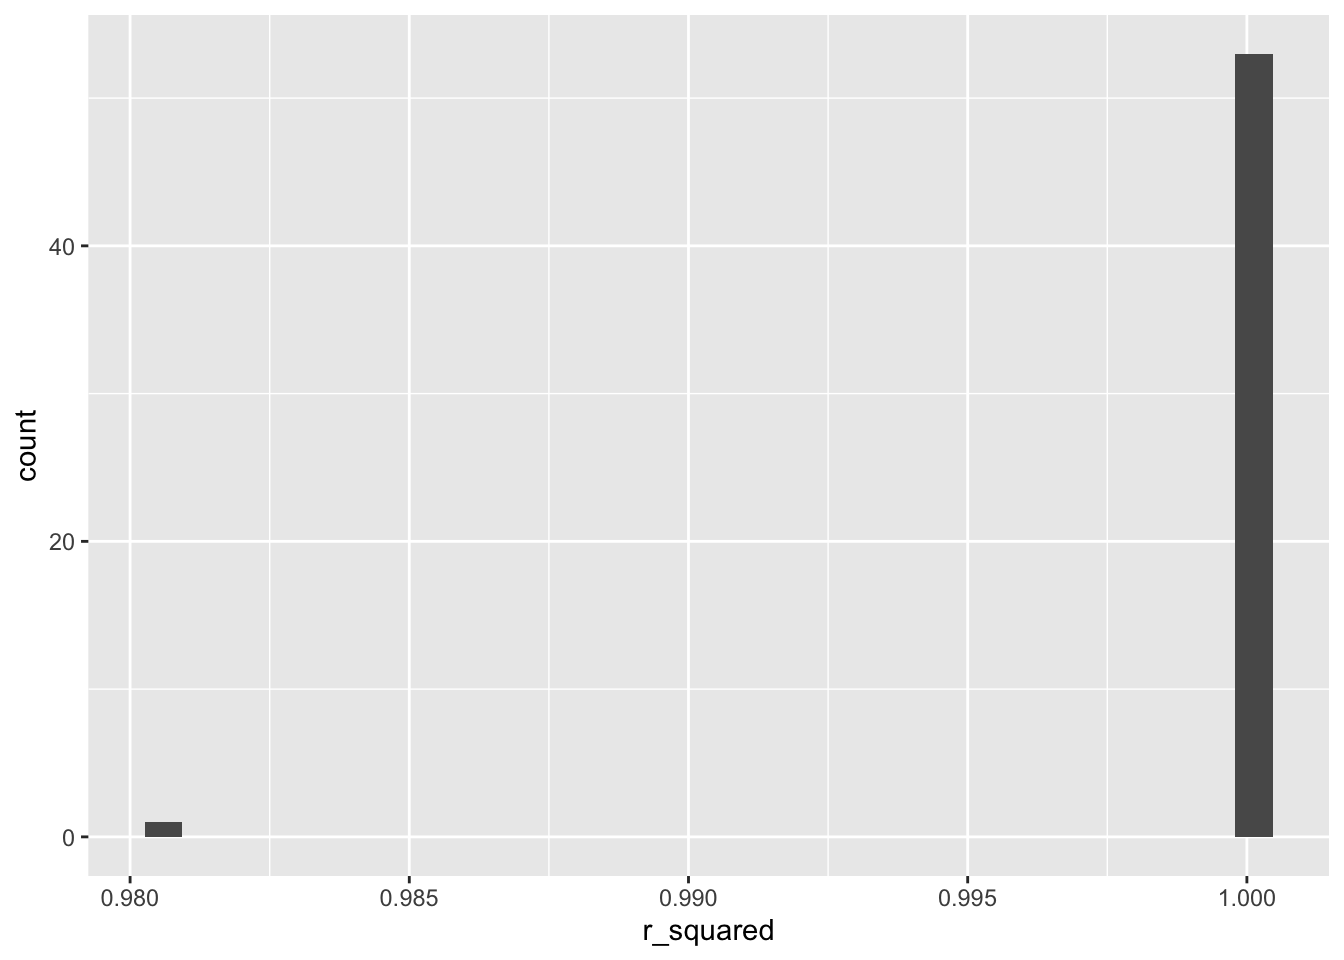
Democratic Vote Share Results Without the Incumbency Variable Included
Below, my model remains the same, except the incumbency variable has been excluded. What we see is an improvement on the predicted percentages, with none arriving below 0% or above 100%. However, the r-squared graph worries me, as now ALL districts have an r-squared of 1. While a higher R-squared is always desired, a value of 1 often should raise eyebrows in suspicion. Since all boast an R-squared value of 1, I am very pessimistic of this model and its effectiveness.
##           state district     pred
## 1       Arizona        6 44.70964
## 2    California       22 47.33018
## 3    California       25 18.66752
## 4    California        3 53.99339
## 5    California       45 52.00314
## 6    California        9 55.05171
## 7       Florida       13 44.78958
## 8       Florida       15 47.05876
## 9       Florida       16 43.64914
## 10      Florida        7 45.69328
## 11      Georgia       12 52.37594
## 12      Georgia        6 50.37441
## 13     Illinois       11 57.76930
## 14     Illinois       14 52.56082
## 15     Illinois       17 50.15744
## 16     Illinois        6 53.57402
## 17     Illinois        8 54.89513
## 18       Kansas        3 45.01386
## 19     Maryland        6 82.17224
## 20     Michigan        7 38.06002
## 21    Minnesota        3 44.11395
## 22     Missouri        2 48.03187
## 23     Nebraska        2 49.94089
## 24         Ohio        1 47.79852
## 25         Ohio       10 43.03486
## 26         Ohio        7 45.44143
## 27       Oregon        5 55.38045
## 28 Pennsylvania        1 48.91614
## 29 Pennsylvania       10 48.74613
## 30 Pennsylvania       17 56.42982
## 31     Virginia        2 48.27276
## 32     Virginia        7 50.98233
## 33   Washington        3 47.50643
## 34    Wisconsin        3 59.94716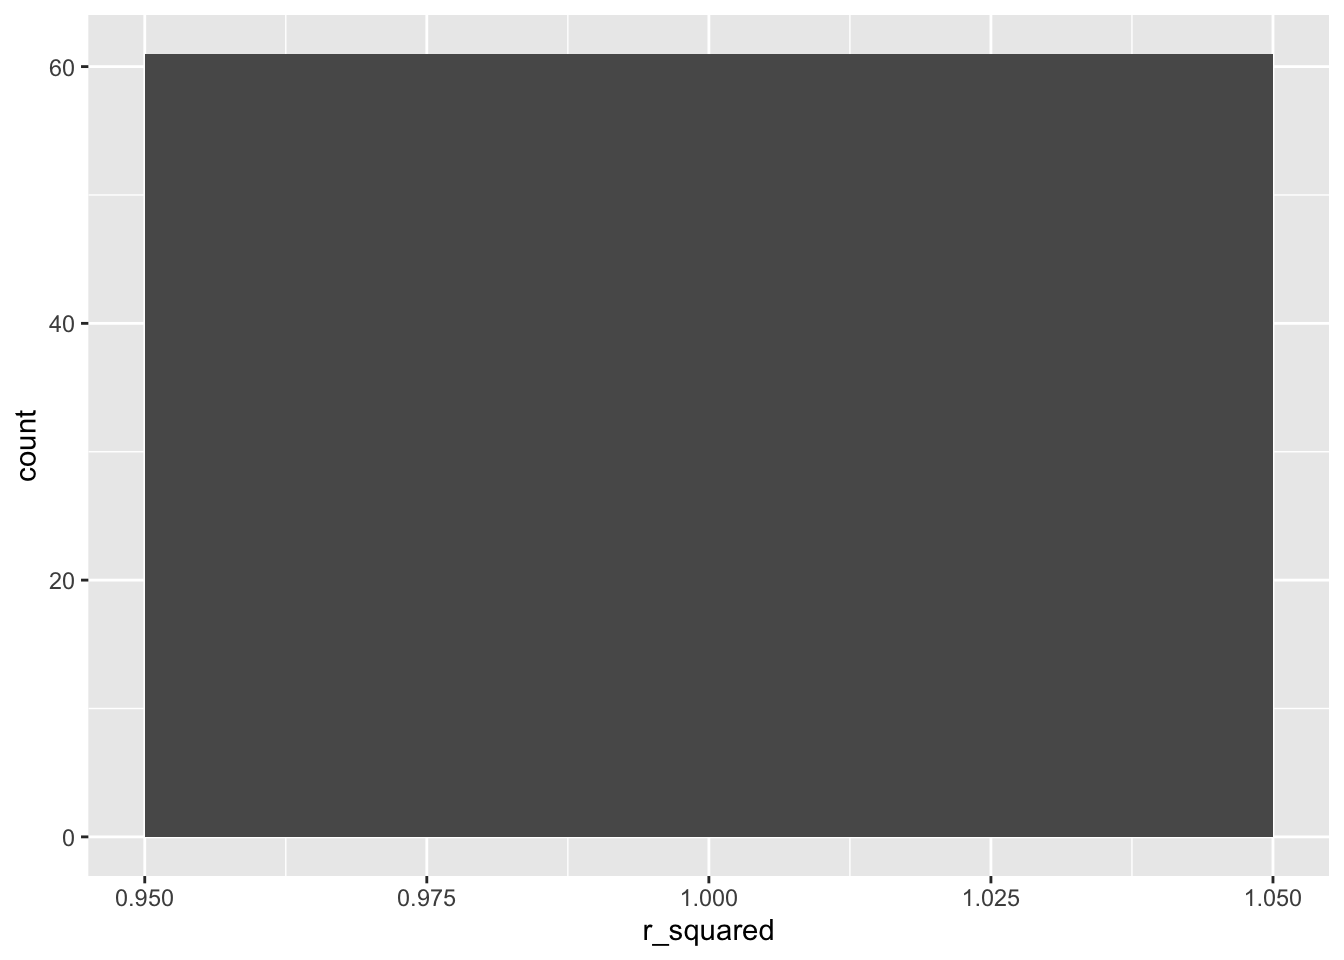
Limitations of My Model
When it comes to turnout, I experienced trouble in finding where it shows promise in predicting elections. Nonetheless, I progressed to including it into my model along with my incumbency variable so I could see how it changes from last week. And, maybe unsurprisingly, my models seemed to get worse. While the incumbency variable seems to check out as a predictor variable, the turnout variable does not seem to provide much value at all.
What could maybe explain the phenomenon that turnout does not matter when it comes to elections is that most campaigns actually counteract their opponents’ ground game since many campaigns have evolved to an advanced state, effectively eliminating turnout as an advantage for one side. In fact, scholars Joshua L. Kalla and David E. Broockman have detailed that persuasive effects rarely, if at all, emerge from ground campaigning, arguing that persuasion resulting from ground campaigning appears only in circumstances of compounding effects from early on in a race and campaigns investing heavily in an extremely unpopular position taken by their candidate. Thus, it does not seem that an advantage can be easily gained by ground campaigning, and maybe it is a zero-sum effort.
So after the past three weeks of decreasing confidence in my model, when I added average expert rating, incumbency, and turnout variables (all shown in my models), I believe it is time to return to more fundamental variables (like real disposable income change, national generic ballot margins, and possibly incumbency too). This decision of mine rests simply on the reality that I am working with data limited in scope. This reality means my models are sometimes working off only 2-3 elections/observations per district, which is far from ideal. Thus, going forward, I believe I am going to include only variables that include data from long ago, allowing for more observations, and data that is possibly more related to the national environment, so as to not depend upon unreliable district data (which could fluctuate as the quality varies district-to-district).
Notes:
This blog is part of a series of articles meant to progressively understand how election data can be used to predict future outcomes. I will add to this site on a weekly basis under the direction of Professor Ryan D. Enos. In the run-up to the midterm elections on November 8, 2022, I will draw on all I have learned regarding what best forecasts election results, and I will predict the outcome of the NE-02 U.S. Congressional Election.