Why Polling Matters
Forecasting elections has been a pastime of politically savvy Americans ever since one can remember. After all, it’s a challenge that no one has yet to master this practice on a consistent, election-to-election basis — there are simply too many changing variables (in terms of presence and weighting) each cycle.
Professional polls attempt to conquer this task by going directly to the voters, asking how they anticipate voting in the next election. Oftentimes, outlets that create forecasts for the upcoming election will incorporate polls from all sources to inform their model, and it is left to the outlet to decide on what polls to include and how much weight to assign to these polls.
FiveThirtyEight, famously founded by prediction expert Nate Silver, releases forecasts each election cycle based on a combination of fundamental variables and polling data. Their models are probabilistic in nature, meaning a 70% chance to win the House is not a guarantee. Depending on the type of election, their use of polling varies: House forecasts by 538 tend to be less polling centric. Silver describes that the magnitude of the races for the House — 435, to be exact — makes it impossible to accurately predict which factors matter and by how much in each district’s race. Polling is sparse and unreliable from district to district, but if high-quality polls arise, they should be factored in as they are a direct measure of the people.
This is where the need for a generic Congressional ballot arrives. Silver states that generic ballot has an increasing importance in their models, even over fundamental variables (like the economy, fundraising, and incumbency). The reason for the generic ballot’s importance is because voters in congressional races tend to be less informed about the candidates and their positions on issues. Professor Ryan Enos has researched this phenomenon of low-information races, which lead to an outsized importance on a candidate’s party affiliation. Therefore, the voters’ affinity for a political party is of importance, and why I will incorporate the generic ballot poll into my own prediction.
G. Elliott Morris runs The Economist’s forecasting operation. Morris highlights in the description of his forecasts that fundamentals-based forecasts tend to be much more steady and better predictors of election outcomes than poll-based forecasts. For a presidential forecast, for example, the fundamental variables that he uses are a president’s net approval rating, GDP growth, and whether or not a first-term incumbent is running for re-election. He acknowledges the ease of over-fitting “fundamental data” (like economic trends, for instance) to a model so it best matches a previous election, however. Because polls and fundamentals can both be useful in predicting elections, I will include both in this week’s updated forecast since my forecast using economic data alone that puts Democrats winning big does not prove to be realistic.
Averaging Polls Across the Board
Polling outlets are often given a grade on their operation: the more accuarte an outlet is over time, the better its grade. However, polls oftentimes tend to hold a bias in terms of consistently over- or underestimating the vote share of a particular party. Variables to consider when finding the source of bias can be pollster-level factors — like accuracy of an operation and its predicted bias — or poll-level factors — such as the sample size, when it was conducted, and if it was for a partisan client.
An efficient way to counter this bias is to aggregate the most unbiased polls that one can find, allowing for polls biased on both sides to balance out each other. Francis Galton once conducted an experiment where he averaged the guesses from informed and invested parties on the weight of an ox. And stunning, the average of the guesses was correct within one percent of the actual weight. Therefore, I will use an aggregate of polls in my forecast to correct for any bias.
Lastly, Polls early on in an election cycle can be vastly different than ones closest to the election date. Gelman and King describe how voters tend to learn during the campaign what issues are most important to them and which candidates with whom they agree on the issues. Gelman and King indicate that early polls do not always reflect the eventual outcome and polls closer to the election normally converge on the actual outcome. Therefore, when using generic ballot polls to inform my own model, I will only filter for polls conducted within 50 days of the election.
Polling and Election Forecasting in Practice
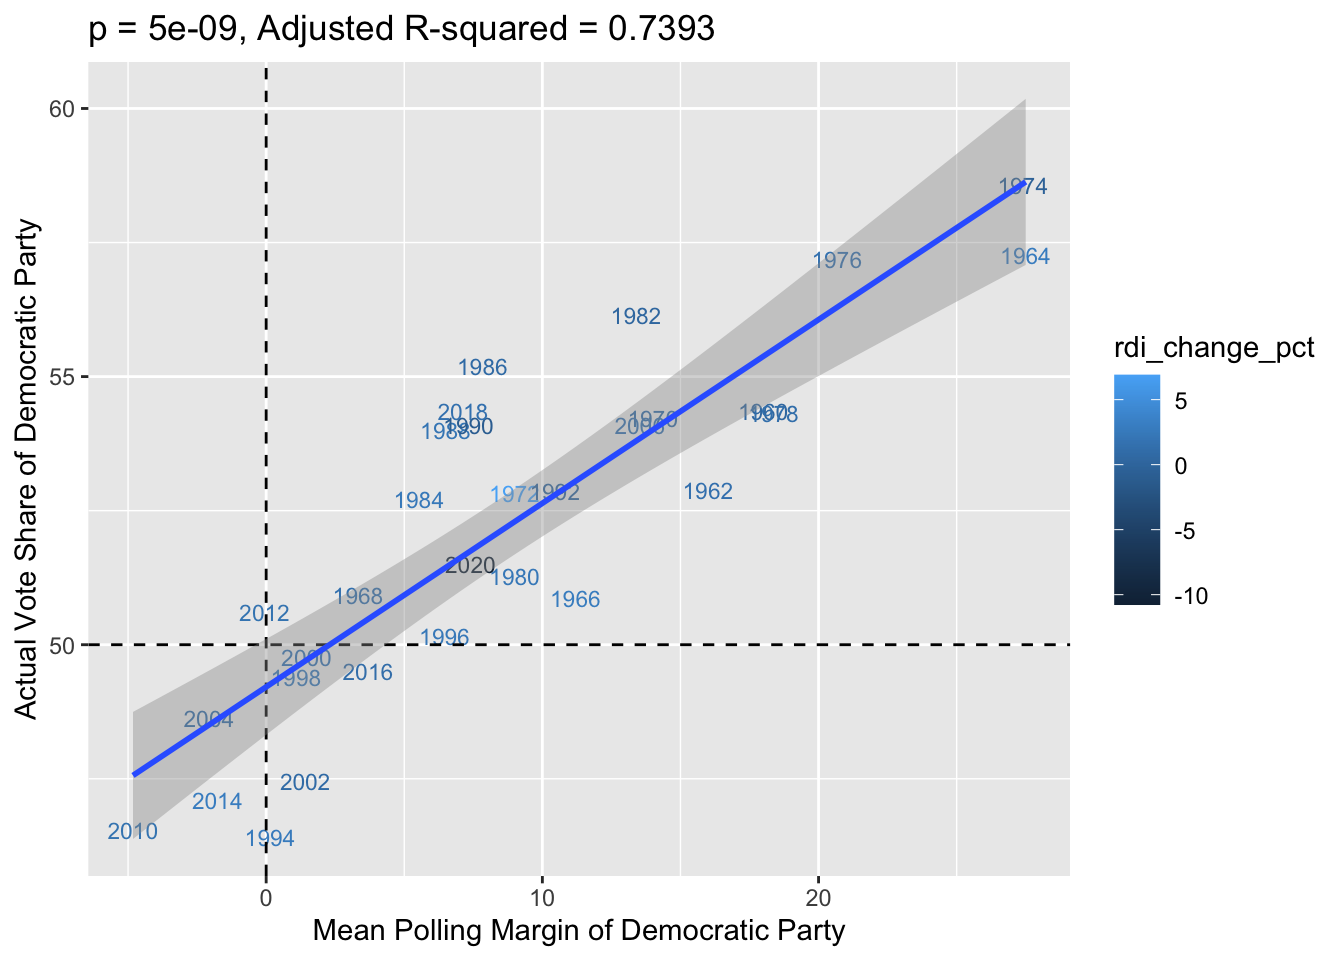
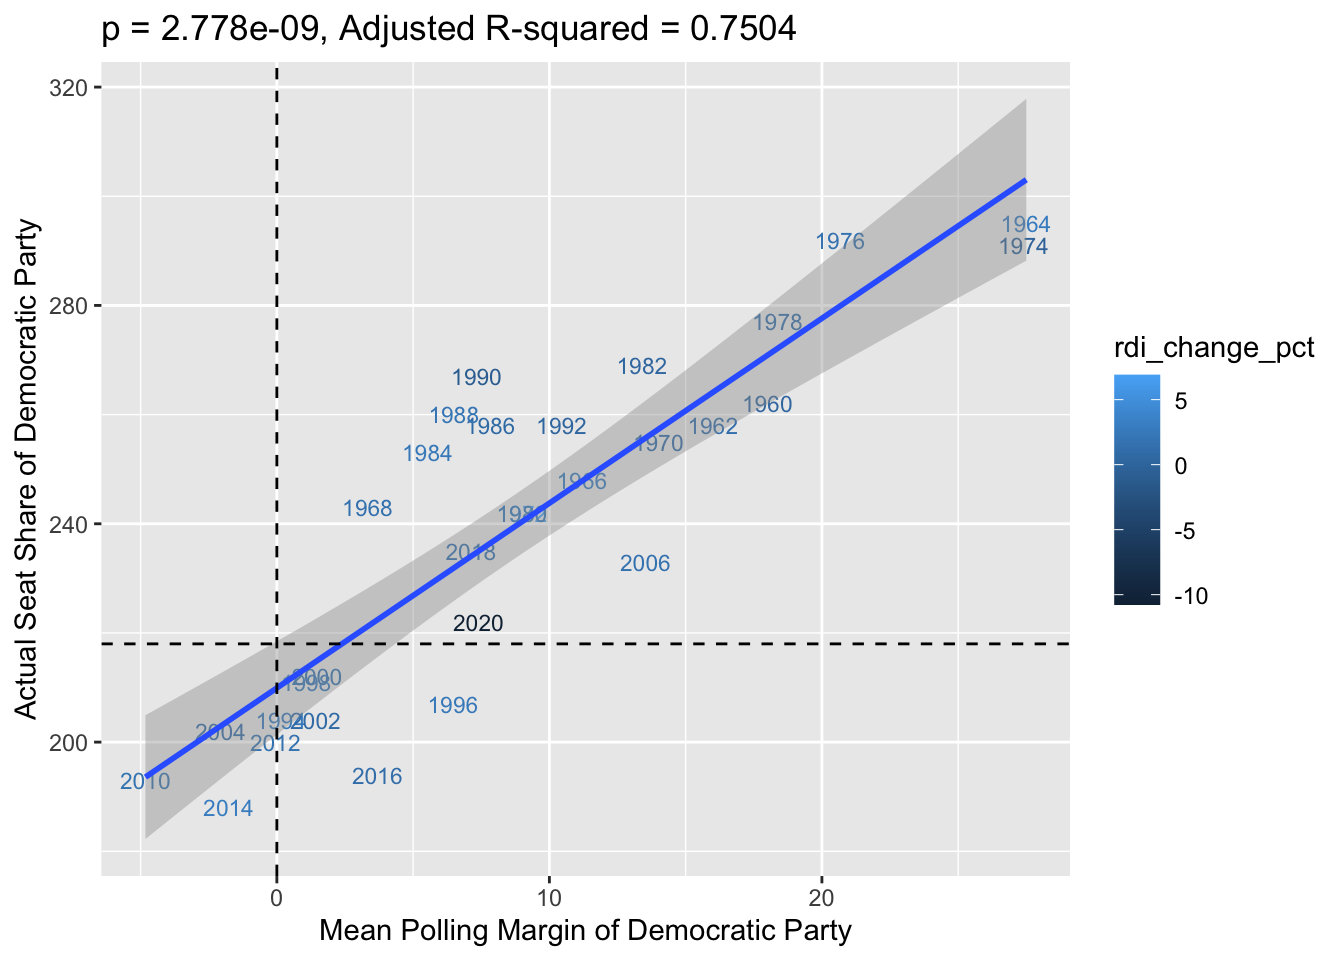
Below, I explore the relationship between the Democrats’ Polling Margin from an aggregate of polls conducted within 50 days of an election and the Democrats’ Actual Vote/Seat Share in the election.
As evidenced below from the strong correlation and Adjusted R-Squared that explains how well the model explains variability in the data, the Democrats’ Polling Margin from an aggregate of polls conducted within 50 days of an election is a strong predictor of their vote/seat share outcome. Including the RDI change from April to November of each election year does not seem to play a huge factor in improving this correlation. However, it does not hurt the modeling.
Vote Share
Seat Share
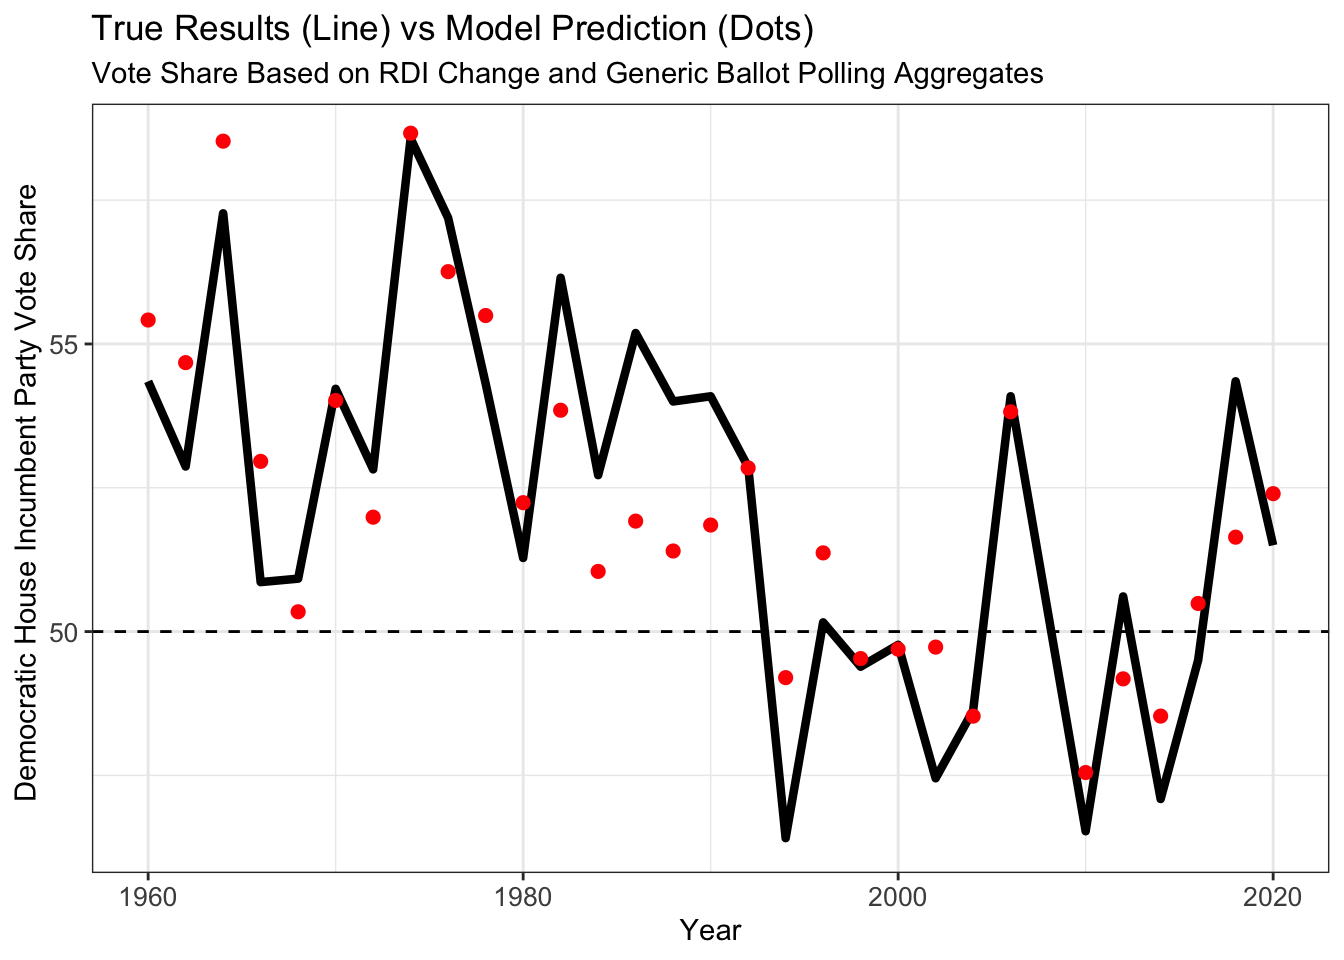
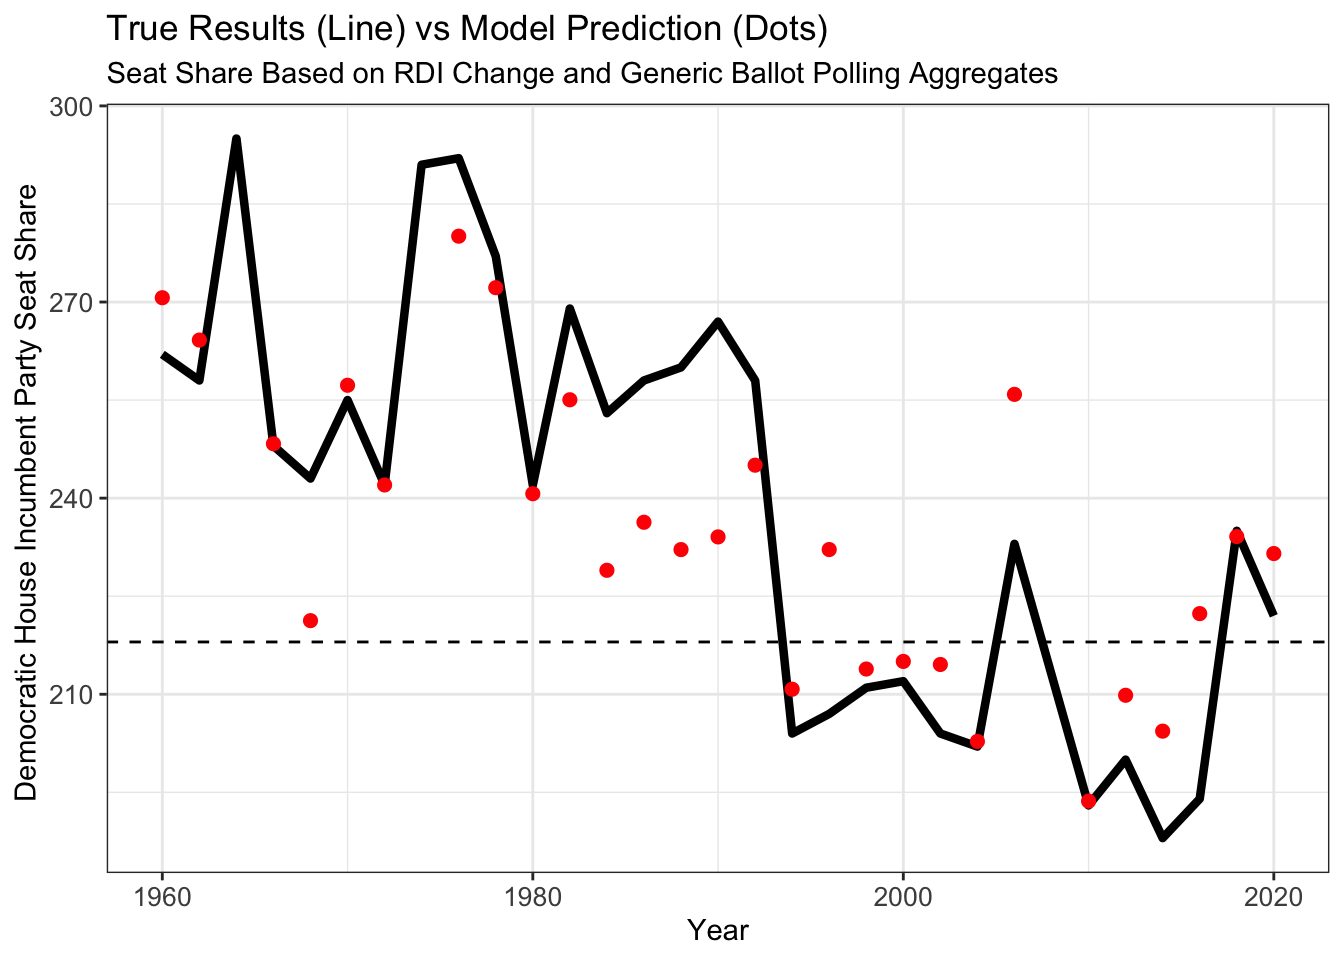
Below includes how well these models stack up against historical data. What is evident, after including polling data with my economic data, is how these models are not exact, but they are matching the trends much better, compared to last weeks economy-focused model. These models are efficient at predicting if the Democrats will lose the vote share and seat share, only missing the vote share prediction once and the seat share prediction twice. However, the exact vote share percentage and seat share count can be more precise.
How My Model Stacks Up Against the Past
Using these models that historically fit the data well, I will update my forecast with the predictions shown below.
Updated Forecast:
Conclusion
Using RealClearPolitics’ Current Aggregated Generic Congressional Ballot, where Democrats hold an advantage +0.3 points and the current RDI change since April of +1.91%, I predict the Democrats to win a national vote share of 49.29% and 211 seats in the House. If this holds, the Democrats will be demoted to the minority party of the House.
However, something special to note is that my prediction intervals remain wide with only these two variables. Thus, more analysis and refining is needed to narrow this interval, since the upper limit of my interval includes the Democrats winning an overall 244 seats (which is still vastly unrealistic and a pipedream for the party, at the moment).
Notes:
This blog is part of a series of articles meant to progressively understand how election data can be used to predict future outcomes. I will add to this site on a weekly basis under the direction of Professor Ryan D. Enos. In the run-up to the midterm elections on November 8, 2022, I will draw on all I have learned regarding what best forecasts election results, and I will predict the outcome of the NE-02 U.S. Congressional Election.