In this blog, I will seek to highlight how advertising in the airwaves can be used in predicting elections. To start, I will explore the relationships between the number of ads run in a district by each candidate and then use the 2018 advertising data as a stand-in, because I currently do not have the data from the current 2022 cycle, for my 2022 midterm elections prediction.
How Ad Money is Distirbuted
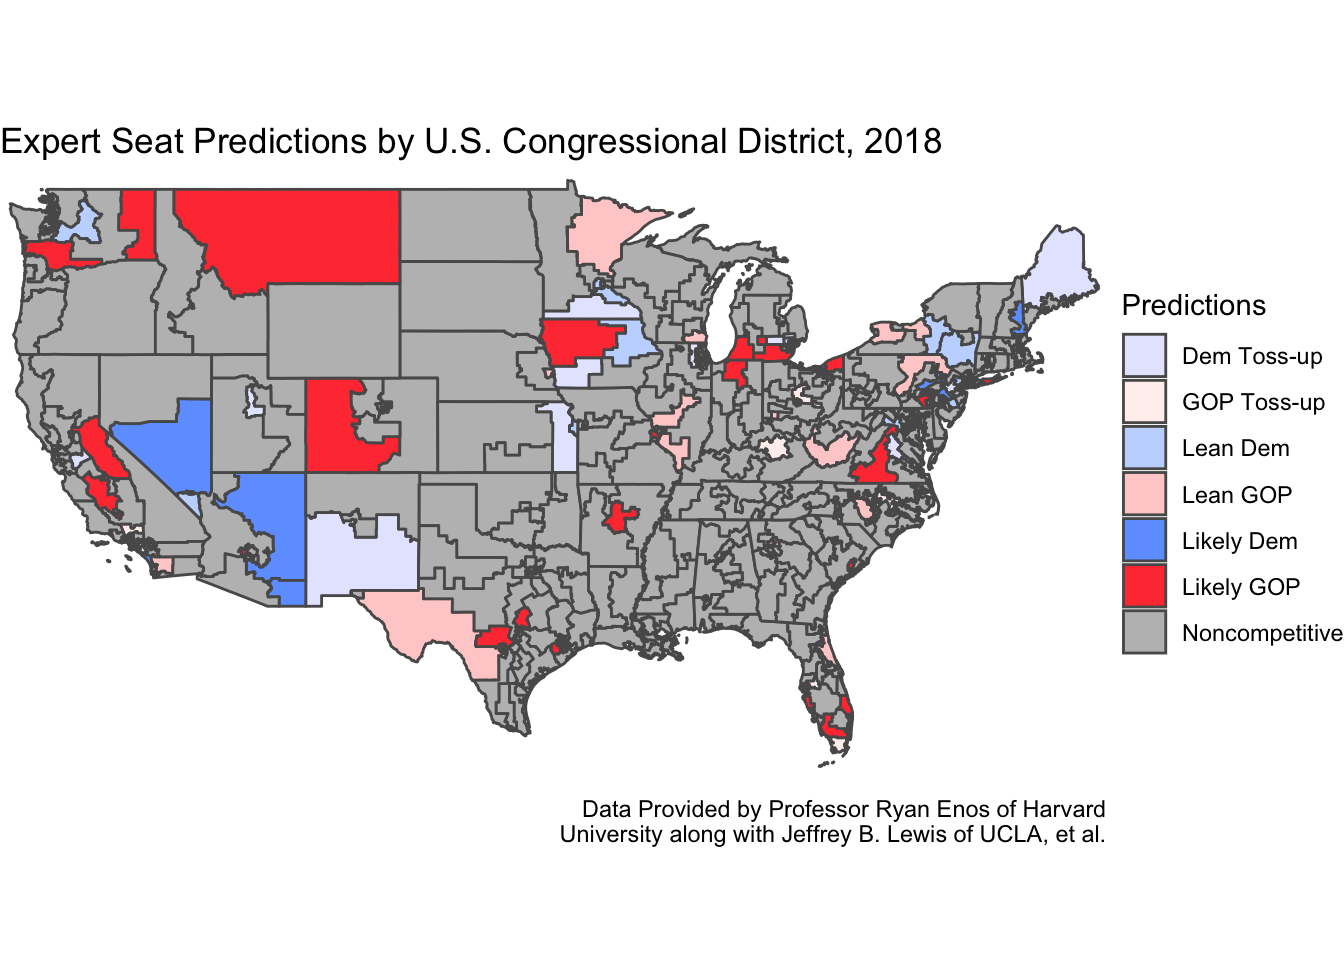
Professor Ryan D. Enos has detailed that not all congressional districts run advertisements over the airways — and that is because many districts throughout the country simply are noncompetitive. When one can predict the outcome of an election in a district with relative confidence, there is no need for an advertising blitz that costs an enormous amount of money. However, in the districts that are competitive, fundraising can run wild, allowing for expensive advertising over the airways. Below is a map of the competitive districts in the 2018 cycle (and notice how few of them there are), with the districts that have a rating of “Solid Dem/Solid GOP” renamed as “Noncompetitive.”
Concentration of Ads in the 2018 Cycle
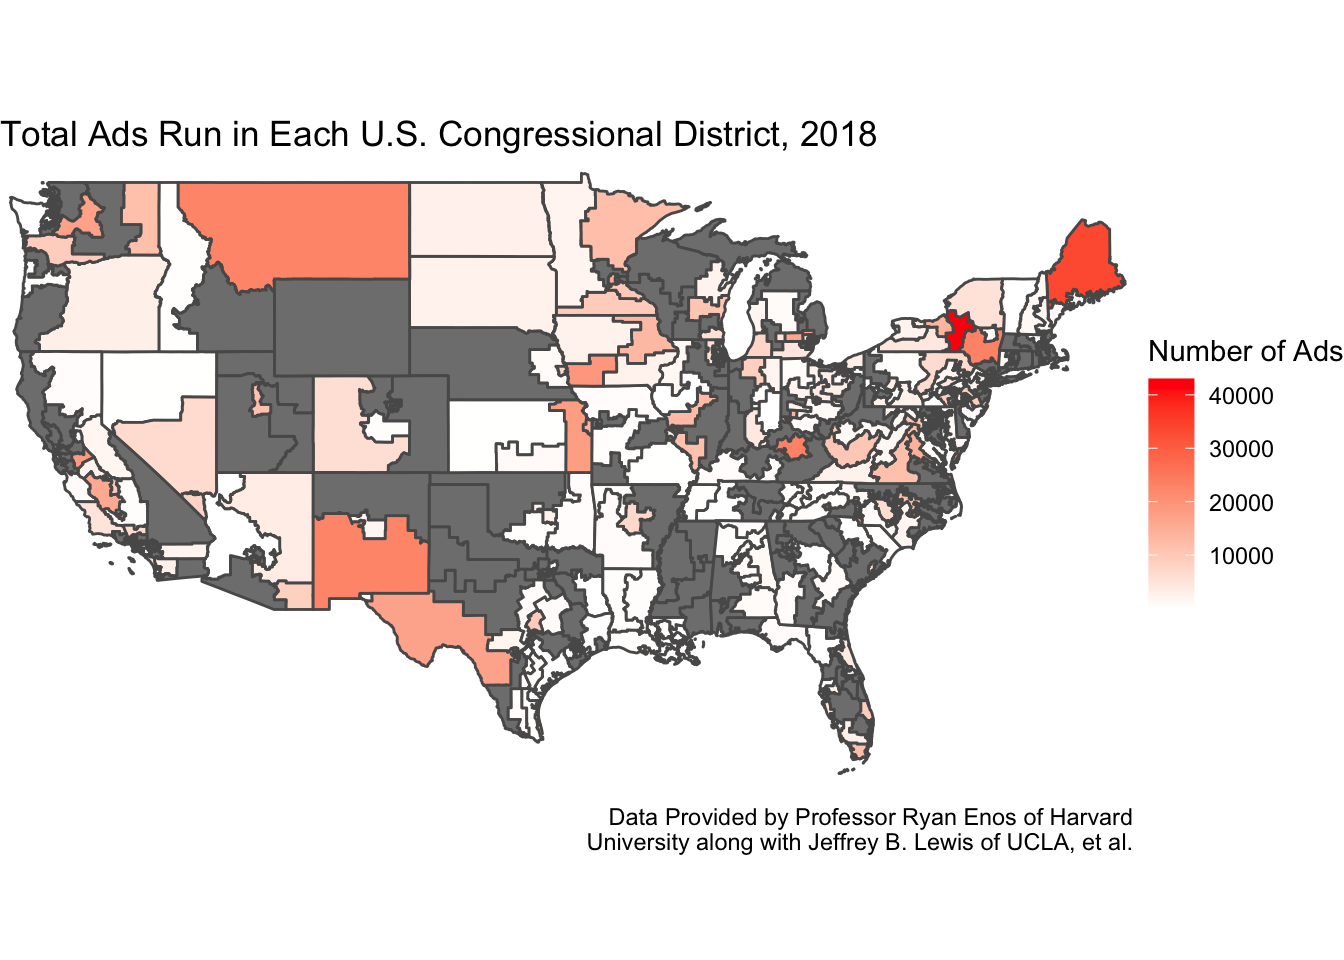
Competition within a district, especially when a district is seem as a “toss-up” battleground between the Democrat and Republican, attracts donor money like no other. Thus, one would expect the districts with lighter shades of their respective color to have more advertisements ran in their cycle than those with darker shades (less competitive). Our graph below confirms the notion that more competition results in larger numbers of advertisements. This is evidenced by competitive districts in states such as Iowa and Minnesota and in regions like the Northeast. Also we can see just how few, if any, advertisements are run in noncompetitive districts.
Which Party Holds the Advantage in the Airwaves
Despite all these ads, one has to wonder whether they advantage one candidate or another. Thus, a way to investigate whether a party gains an advantage in the airwaves is by comparing who runs more ads. Using the total number of ads by party may not allow us to view the entire picture, because if a Democrat runs 2000 advertisements in one cycle, the effect of those ads could be totally negated by 2000 ads run by the Republican opponent as discussed by Ryan D. Enos.
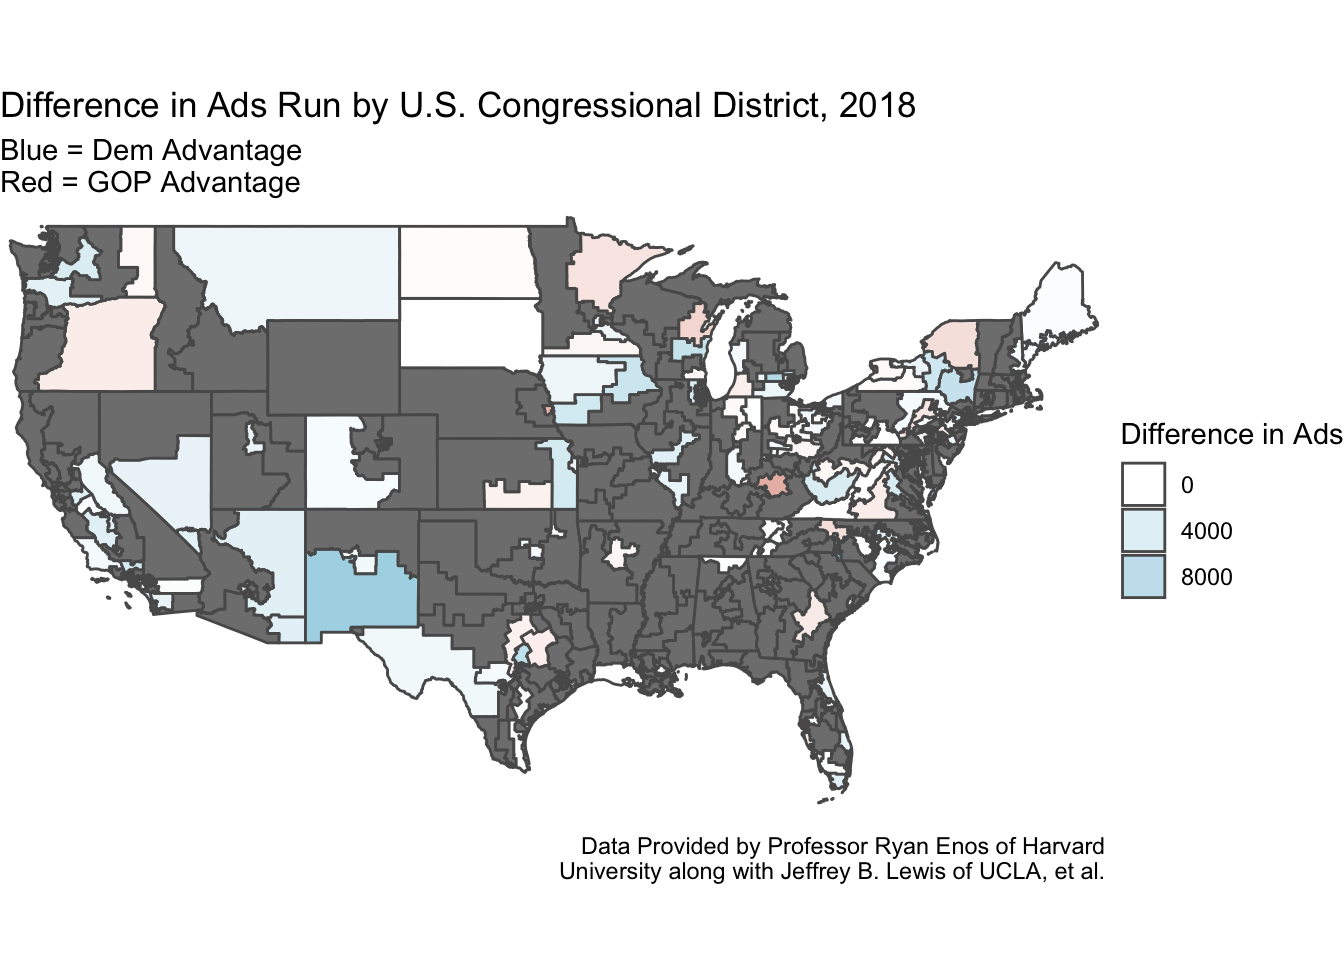
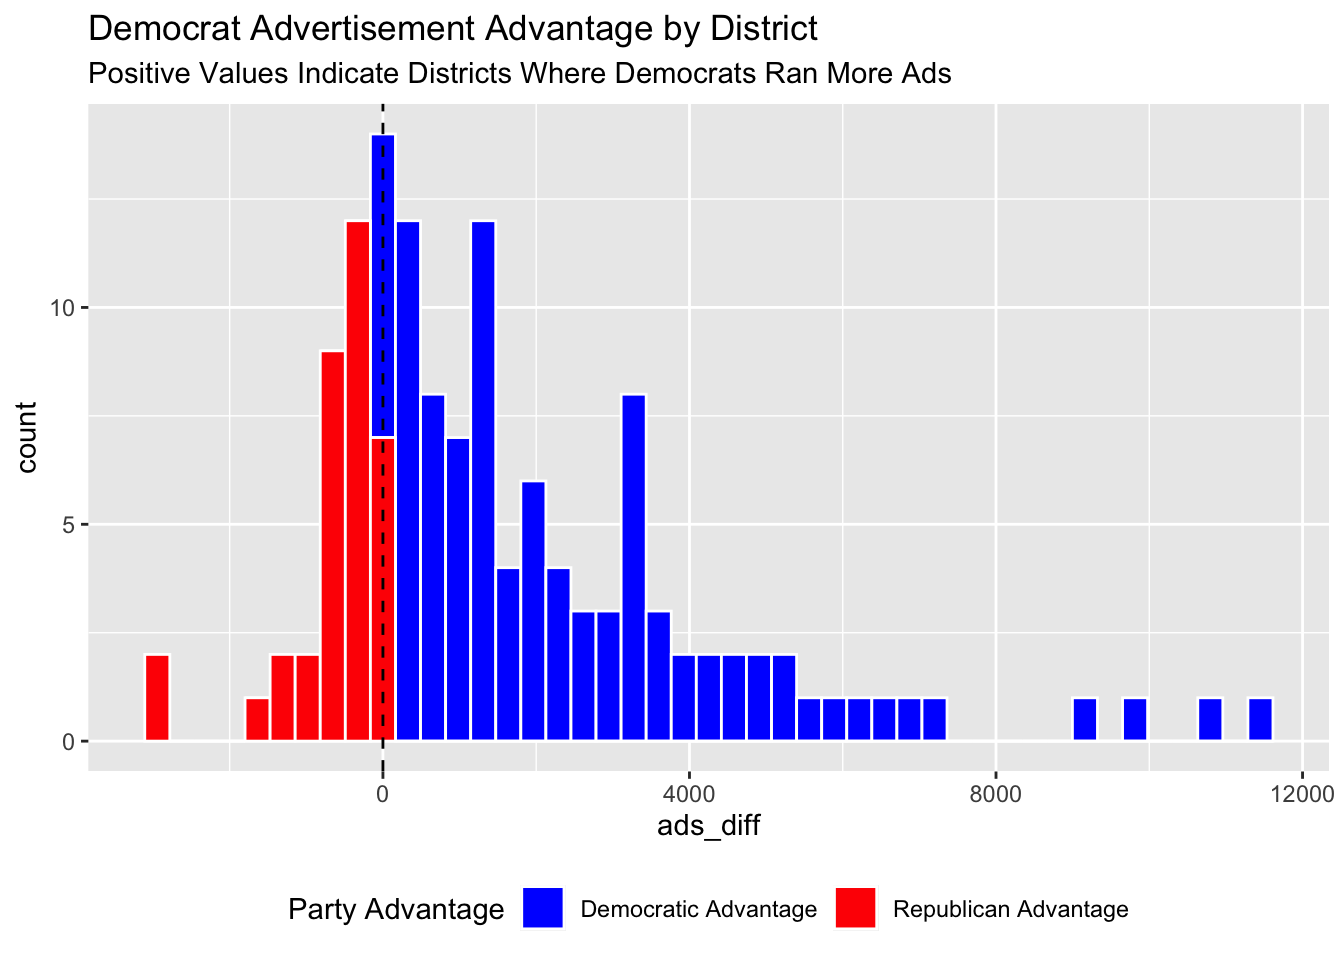
Thus, I believe finding the difference between ads run by the Democratic and Republican candidates will allow us to see who has the advantage in the airwaves. With the map and plot of the 2018 cycle below, we see the Democrats dwarfed the Republicans in advertisements. The big question that remains, though, is whether this strategy to run many more advertisements pays off with a win.
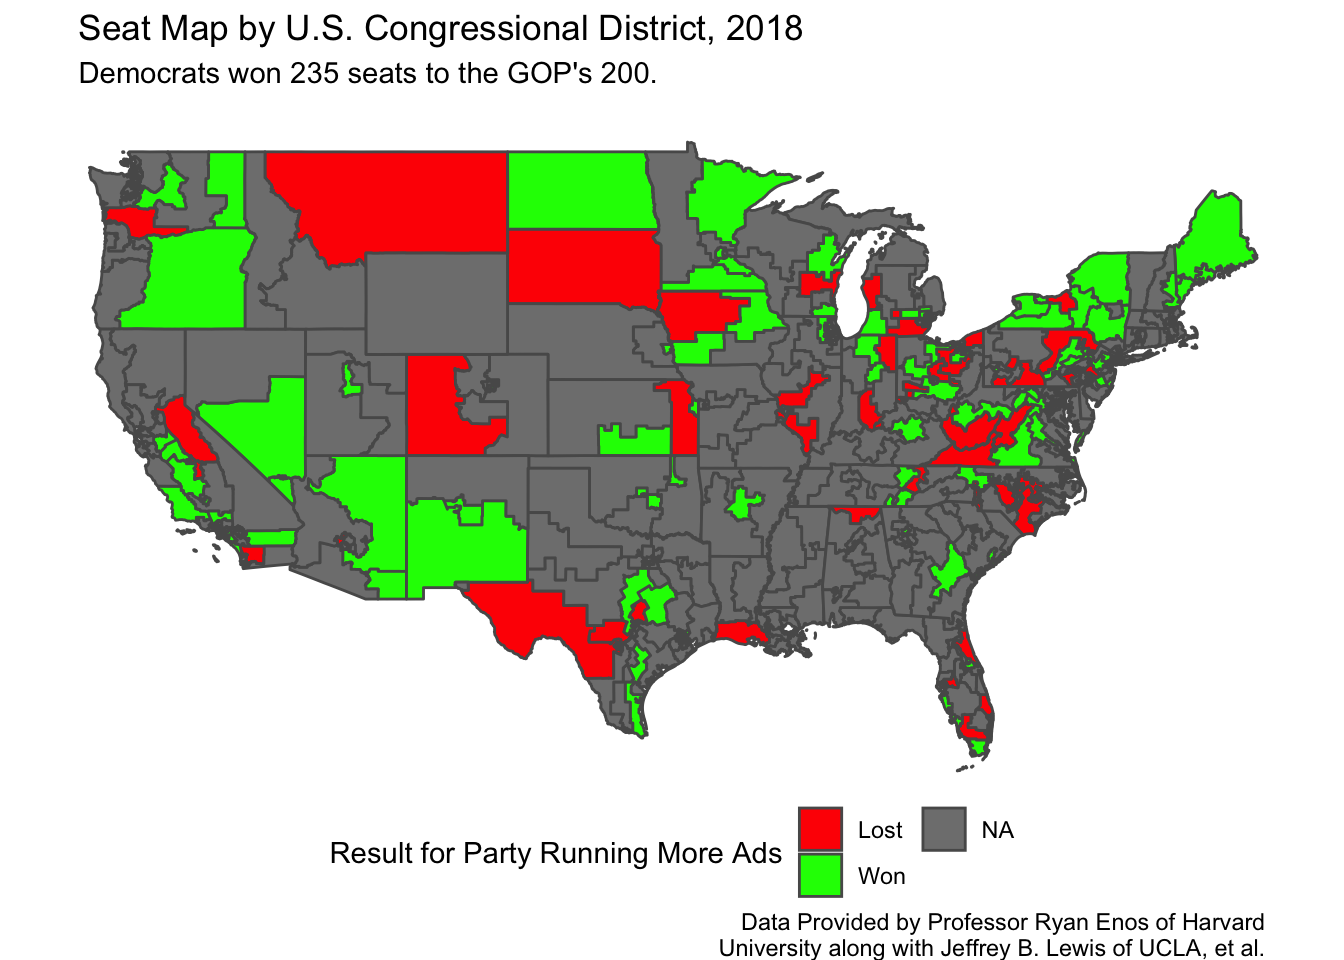
Does an Ad Advantage Lead to Victory?
Scholars Gregory A. Huber and Kevin Arceneaux detail how presidential advertisements do not result in increased mobilization or in increasingly educated voters. However, they did find evidence that voters are persuaded by advertisements. Thus, one might expect the Democrats to perform extremely well in the districts where they enjoy an ad advantage over the Republicans. However, below in the map of 2018 districts, we see that advertisement advantages enjoyed by one party do not seem to ensure victory, and that an ad advantage is roughly unpredictive of election results.
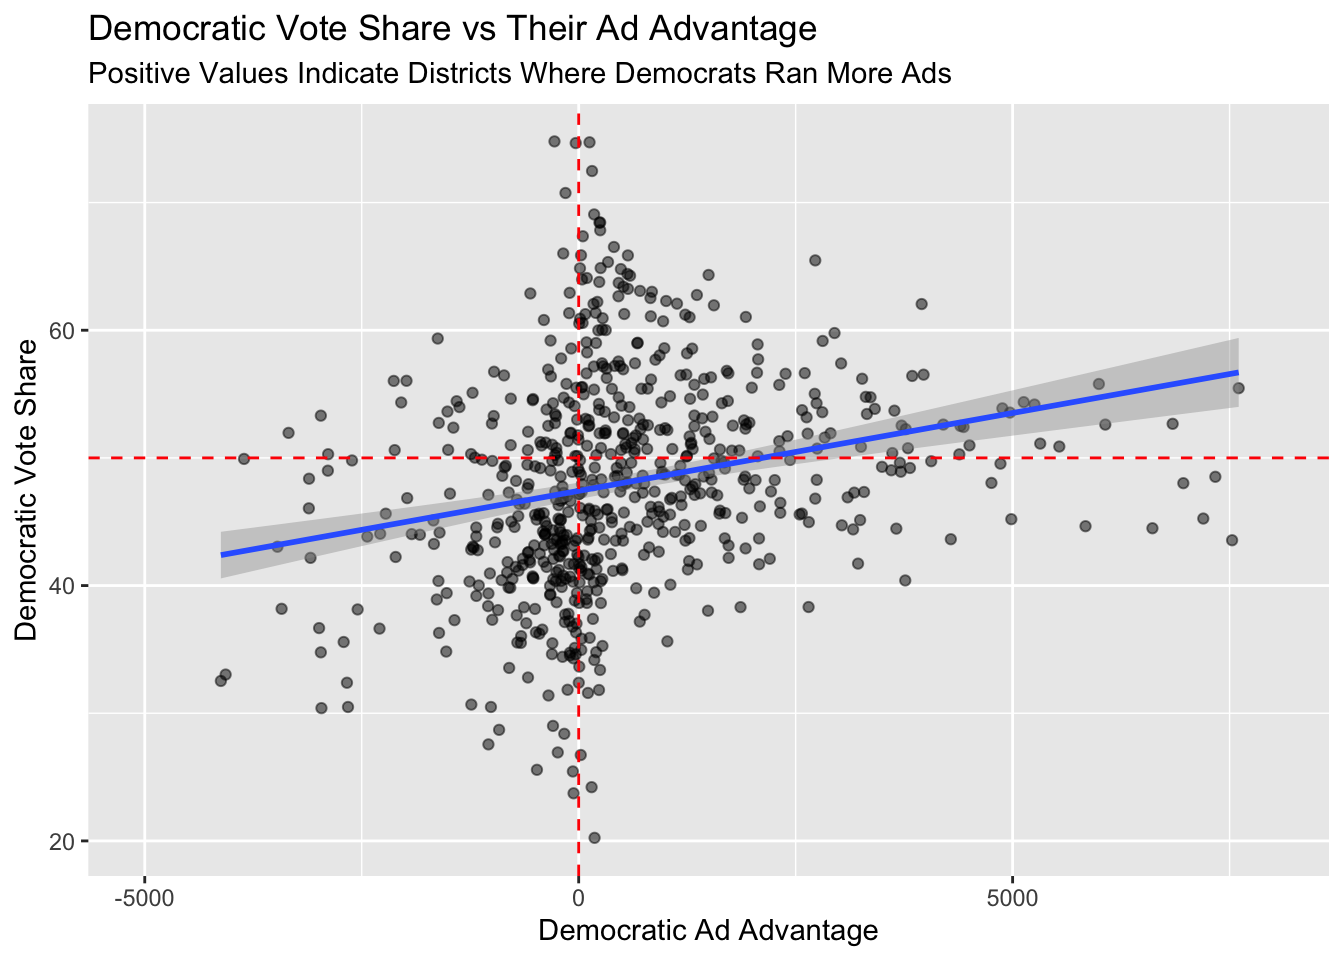
Historical Ad Advantage Trends
Here we compare ad advantages by district since the 2010 cycle, and what we see is a weak positive relationship between a Democrat’s ad advantage and their ensuing vote share.
Updated Prediction Model
Despite this weak correlation between a Democrat’s ad advantage and their resulting vote share, I am going to incorporate it into my model alongside the national real disposable income percent change and national Democratic congressional ballot margin. This is because I want to see if one more predictor allows me to increase my predictive accuracy district-by-district.
Results by Congressional District
##             state district       pred
## 1         Arizona        1  51.562785
## 2         Arizona        2  55.609538
## 3         Arizona        8  56.537372
## 4         Arizona        9  52.055197
## 5        Arkansas        2  42.979884
## 6      California       10  47.166433
## 7      California       16  57.299829
## 8      California       21  47.615304
## 9      California       24  43.893546
## 10     California       25  61.867612
## 11     California       36  53.134300
## 12     California       49  63.097873
## 13       Colorado        3  56.576760
## 14       Colorado        6 104.532504
## 15        Florida       16  47.137591
## 16        Florida       18  53.465560
## 17        Florida       25  49.985013
## 18        Florida       26 220.134216
## 19        Florida       27  61.047462
## 20        Florida        7  63.898023
## 21        Georgia       12  52.375939
## 22         Hawaii        1  53.010471
## 23       Illinois       12 -29.604462
## 24       Illinois       13  48.651815
## 25        Indiana        2  61.564711
## 26        Indiana        9  44.913798
## 27           Iowa        1  52.427763
## 28           Iowa        3  51.771885
## 29           Iowa        4  44.599569
## 30         Kansas        3  70.329869
## 31       Kentucky        6  45.795959
## 32          Maine        2  50.036487
## 33       Michigan       11  45.413310
## 34       Michigan        6  23.656057
## 35       Michigan        7  41.059946
## 36       Michigan        8  37.648939
## 37      Minnesota        2  45.230577
## 38      Minnesota        3  68.295995
## 39      Minnesota        8  51.745259
## 40       Nebraska        2  52.751842
## 41         Nevada        3  52.767938
## 42         Nevada        4  36.245733
## 43  New Hampshire        1  69.742337
## 44     New Jersey        3  61.252181
## 45     New Mexico        1  63.741459
## 46     New Mexico        2  38.720456
## 47       New York       19  48.523495
## 48       New York       21   9.905704
## 49       New York       22  37.418481
## 50       New York       23  37.363502
## 51       New York       24  32.185062
## 52       New York       25  58.071861
## 53       New York       27  48.737837
## 54 North Carolina        2  51.838499
## 55 North Carolina        7  55.278052
## 56           Ohio        1  46.650562
## 57           Ohio       12  37.232103
## 58           Ohio       14  41.649195
## 59           Ohio       15  45.823593
## 60           Ohio       16  54.716334
## 61           Ohio        7  45.441435
## 62   Pennsylvania       10  41.234686
## 63   Pennsylvania       11  38.300278
## 64   Pennsylvania       16  51.278902
## 65   Pennsylvania       17  54.794083
## 66   Pennsylvania        8  52.968153
## 67          Texas       23  48.968214
## 68           Utah        4  57.663631
## 69       Virginia       10  39.999776
## 70       Virginia        2  44.188779
## 71       Virginia        5  52.423006
## 72     Washington        3  46.751349
## 73     Washington        8  43.798095
## 74  West Virginia        2  45.490206
## 75  West Virginia        3  34.531391
## 76      Wisconsin        6  43.709606
## 77      Wisconsin        8  45.829126
Here we the predicted vote shares of 77 districts. Some predictions are plausible, as many lie around 40-60 percent, which is where election results tend to fall for candidates. However, I am skeptical of this model, as my district of interest for this blog, NE-02, shows the Democratic candidate winning with 52.75. Historically, this district has been ultra-competitive, but a Democrat has not achieved about 50% there in quite some time (and is predicted to be unlikely this cycle by most major outlets.)
Additionally, there are some critical pitfalls to this model that shows some districts boasting predicted vote shares above 100% and below 0%, both of which are impossible in a vote.
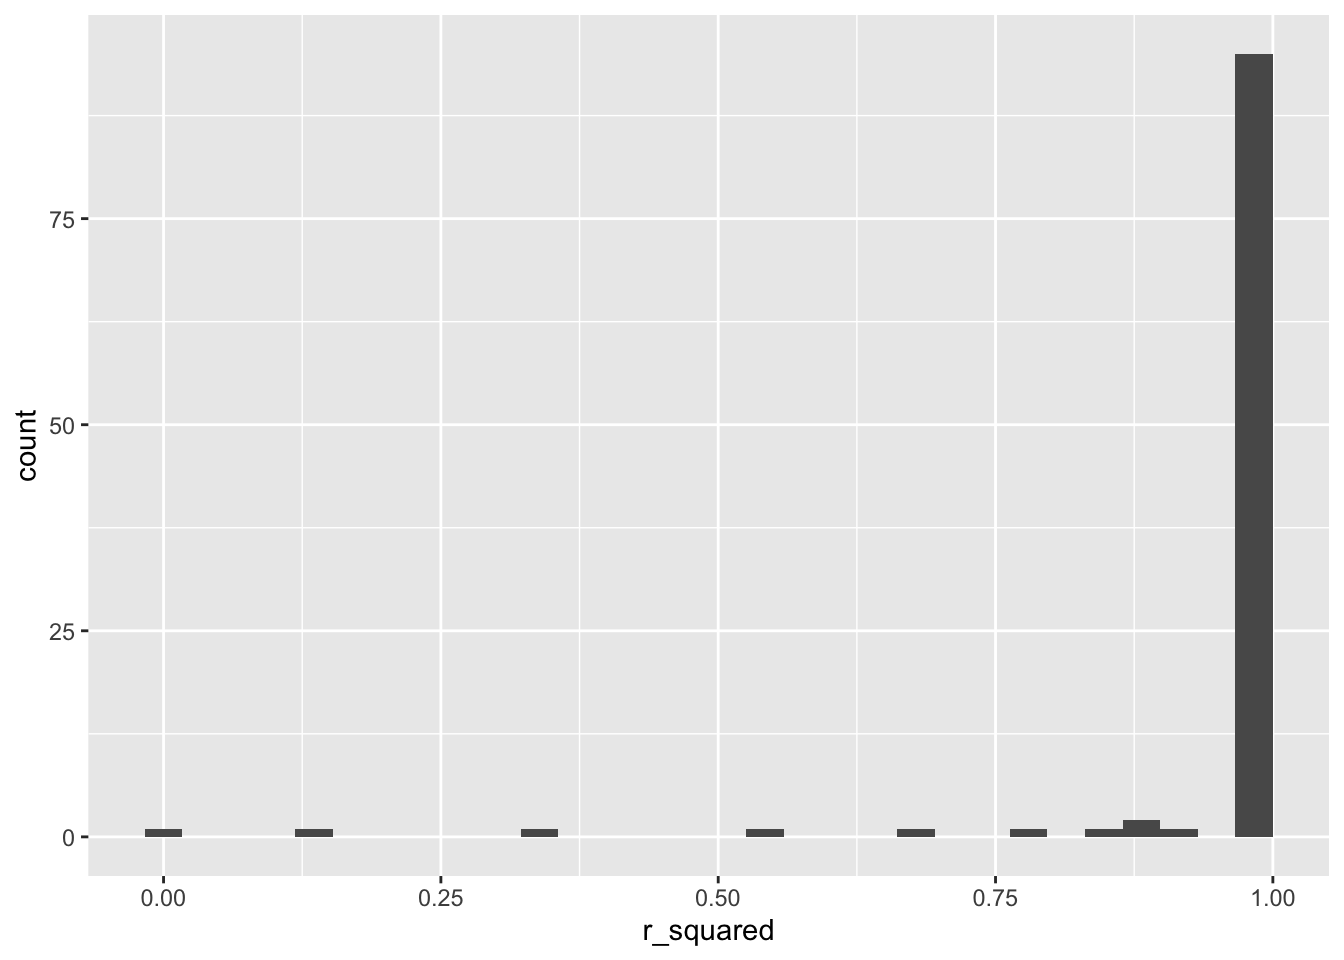
R-Squared Comparisons
Just like last week’s forecast, the R-squared numbers for my predictions by district are graphed below, and while a higher R-squared is always desired, a value of 1 often should raise eyebrows in suspicion. Due to the sheer number that boast an R-squared value of 1, I am very pessimistic of this model and its effectiveness.
Limitations of My Model
Therefore, after visualizing the trends and updating my model, I am not certain that the Democratic Ad Advantage variable should be included in my overall forecast. This blog resulted in me getting smaller R-squared values and predicting less districts (due to less data being available on this front).
A big note on advertisements that could explain why the aggregate variable may not be the best predictor is because the persuasive effects of advertisements have been shown to dissipate rapidly by scholar Alan S. Gerber, et. al. Dr. Gerber goes on state that within a week or two after an advertisement has been run, its effects will have “all but disappeared.” Therefore, by finding the difference between the total number of ads run by candidates in a cycle, we are accounting for ads run in May of an eleciton year. And frankly, those ads seem to wear off even before May turns into June. Thus, a better way to use a variable incorporating the number of ads would be to include only advertisements run two weeks before an election date.
Notes:
This blog is part of a series of articles meant to progressively understand how election data can be used to predict future outcomes. I will add to this site on a weekly basis under the direction of Professor Ryan D. Enos. In the run-up to the midterm elections on November 8, 2022, I will draw on all I have learned regarding what best forecasts election results, and I will predict the outcome of the NE-02 U.S. Congressional Election.