This blog is part of a series of articles meant to progressively understand how election data can be used to predict future outcomes. I will add to this site on a weekly basis under the direction of Professor Ryan D. Enos. In the run-up to the midterm elections on November 8, 2022, I will draw on all I have learned regarding what best forecasts election results, and I will predict the outcome of the NE-02 U.S. Congressional Election.
House of Representatives Election Data Analysis
In this inaugural blog, I am examining data on elections for the U.S. House of Representatives in the 2010’s in order to better see how it can translate into an effective model for the 2022 midterm elections. A prominent question is how we can look at vote share margins and seat shares in congressional districts and use that data as a baseline to predict future election outcomes. By witnessing trends over time in a district’s vote share margins and the capability of a district to elect an official of a certain party, one can plausibly predict the direction where that district is headed in the future.
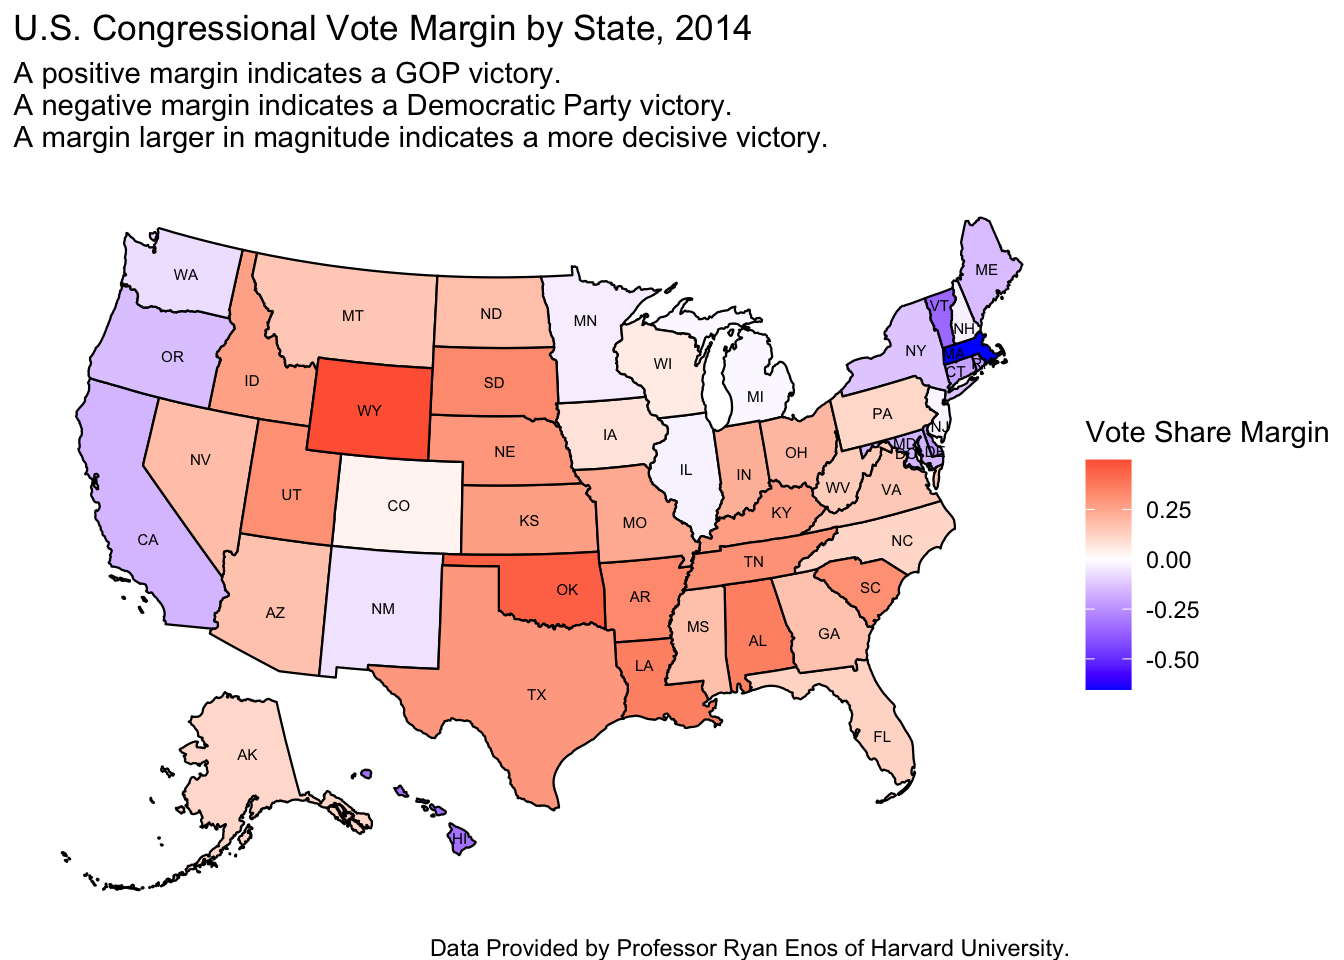
Party Vote Share Margins By State
One of the most fundamental aspects to the House of Representatives is its roots in being the federal legislative body closest to the citizenry. Every two years, 435 districts across the country elect a representative to carry their interests to Washington DC. Scrutinizing voting trends in these elections at district-wide, statewide, and nationwide levels is of great interest to those tapped into politics, because biennially there is new data on the country’s ever-changing political temperature. In the visualization below, each state displays their respective vote share margin that the party who wins a majority of votes possesses. For instance, Wyoming boasts a hearty red color, indicating that Republicans win a much larger share of the total votes cast than Iowa with its faded red. Wyoming and California are known to be strongholds for Republicans and Democrats, respectively, but no matter how large a party’s margin in any state, there are only a certain number of members they can elect to the House. Also, looking at the vote share margins at a district level is more informative, because districts can often be drawn to heavily favor one party, potentially contributing to a false notion that a party has full control over one state.
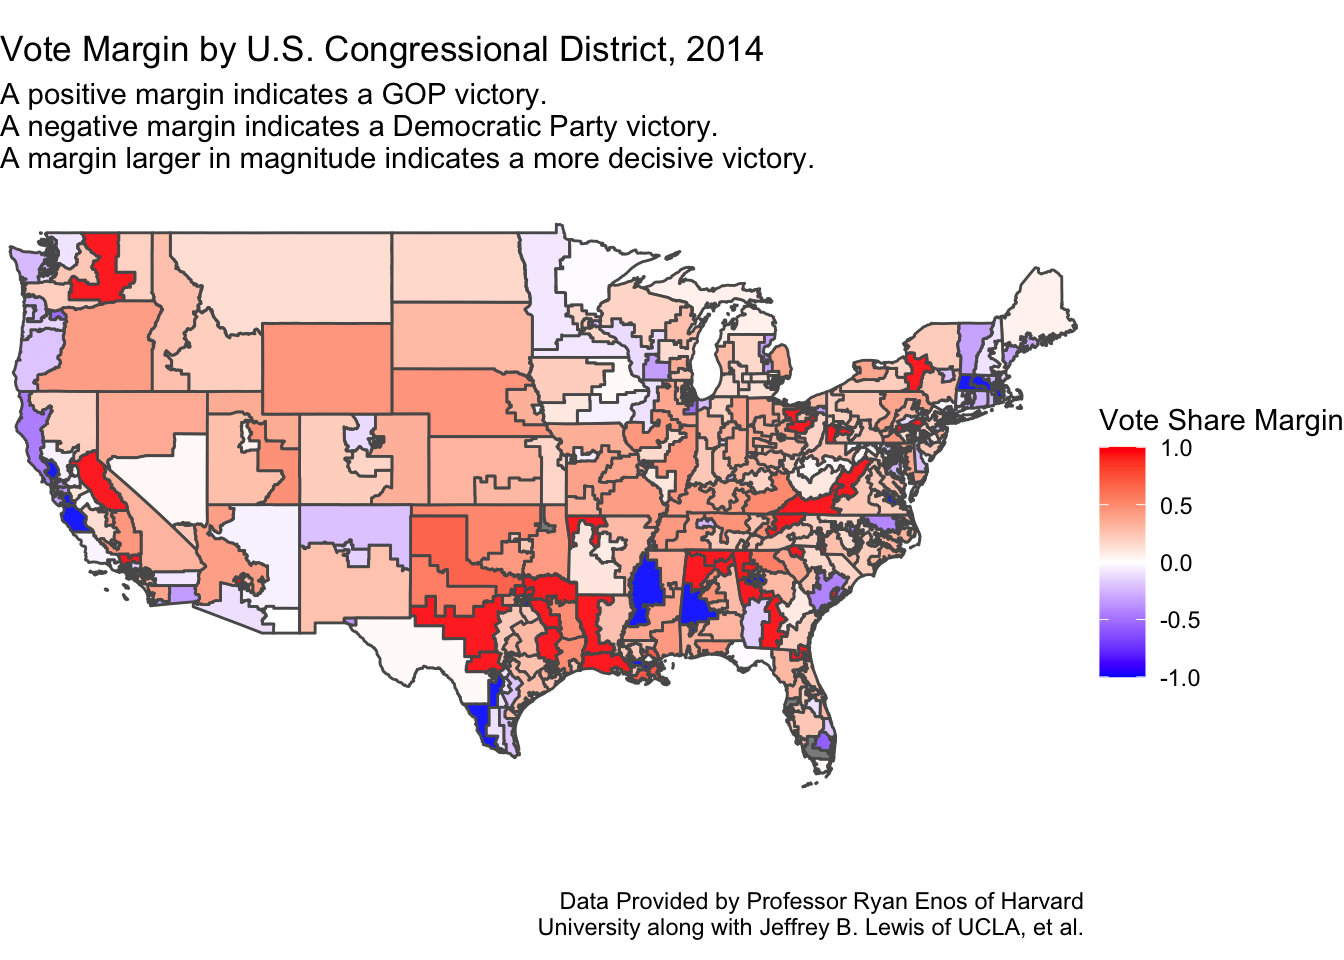
Vote Margin by U.S. Congressional District
Here we can further take a peek into how Democrats and Republicans perform on a district level. Oftentimes districts lack competition between the parties because of gerrymandering that works to assist a political party by lessening their probability of being defeated in the general election by the candidate of the opposing party. Gerrymandering often leads to heated primaries between members of a party since there is not as large of an incentive to win over independents or members of the opposing party, of which there are so few. From the previous visaulization, it would be easy to deduce that states with a large GOP vote share margin like Alabama would not elect a Democrat as a representative for their delegation to the House. However, upon examining Alabama on a district-level, we can see they did elect a Democrat in 2014 with strong enthusiasm. Gerrymandering is one way you can explain this: when the new district maps were being drawn, the GOP-sided officials in charge acknowledged there were a fair share of Democrats residing in the west side of Alabama. Instead of dispersing them across many districts, and allowing Republicans to become potentially more vulnerable in them, the GOP conceded only one district to the Democrats, thus saving the many others for themselves. Examining how these districts change in shape and in how voters vote over time can be a great insight into future outcomes.
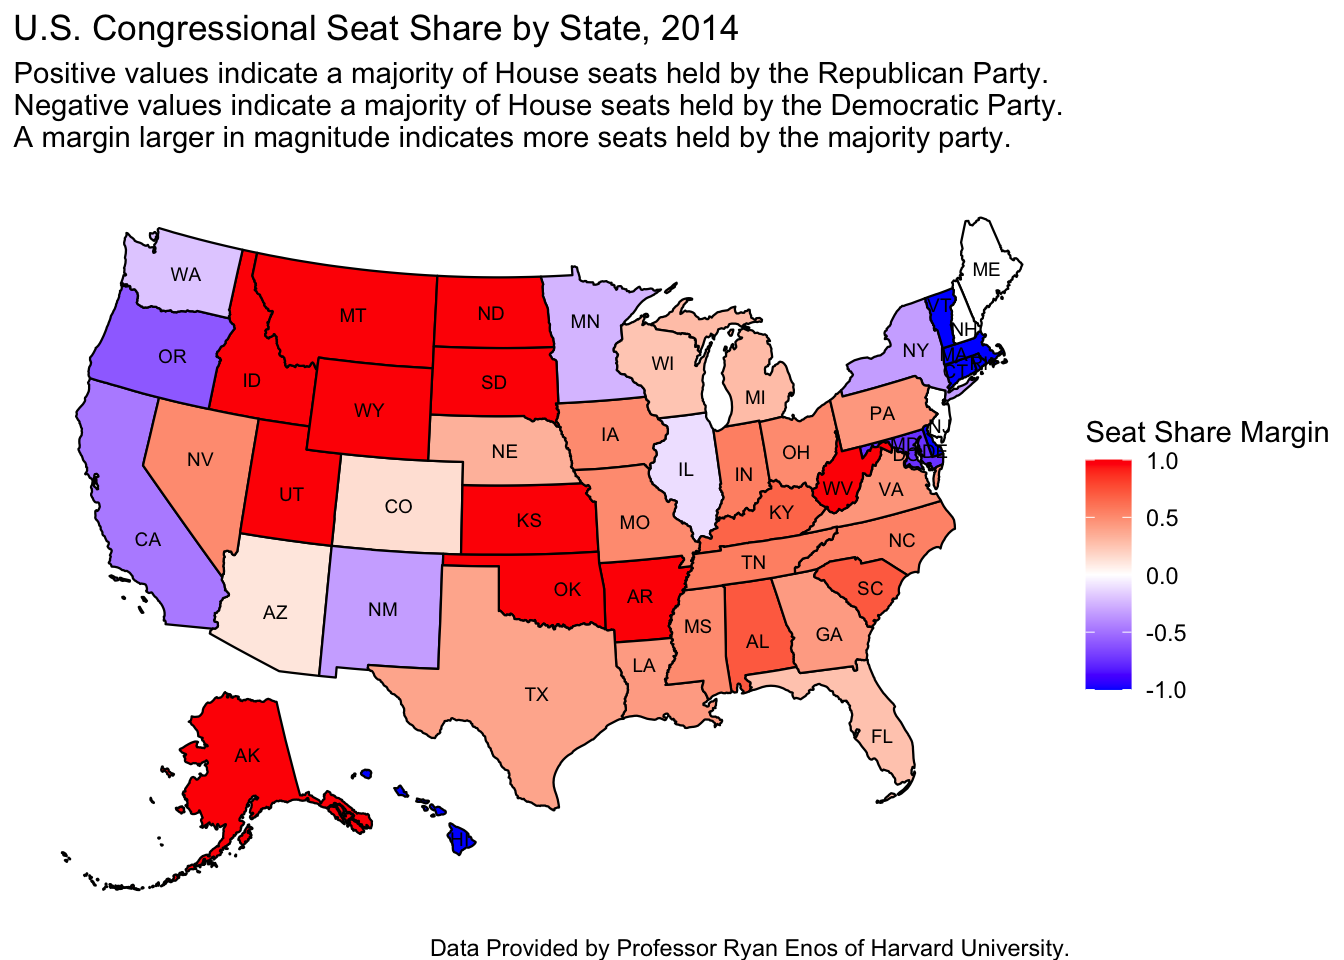
Congressional Seat Share
Looking at Congressional Seat Share gets to where the real power lies in Congress: the more seats your party possesses, the more powerful you can be in your duties. For instance, the Democrats can win a district by 99 points or 1 point, and in either situation, they would send only one representative to the House. The ability of a party to win a district is a crucial element to their agenda. Getting 48 percent of the vote, which slims down the vote share margin of the winning party, nonetheless results in a lost election. For example, if the Democratic Party consistently gets 45% of the vote in a particular district’s election, and thus losing each time, then that can serve as a good predictor that the GOP most likely will win future elections. Here we see that most states are heavily dominated by one party, with few residing right on the line of equal numbers of representatives from the GOP and Democratic Party.
Relating Back to Nebraska’s 2nd Congressional District
Nebraska’s Living Bipartisanship
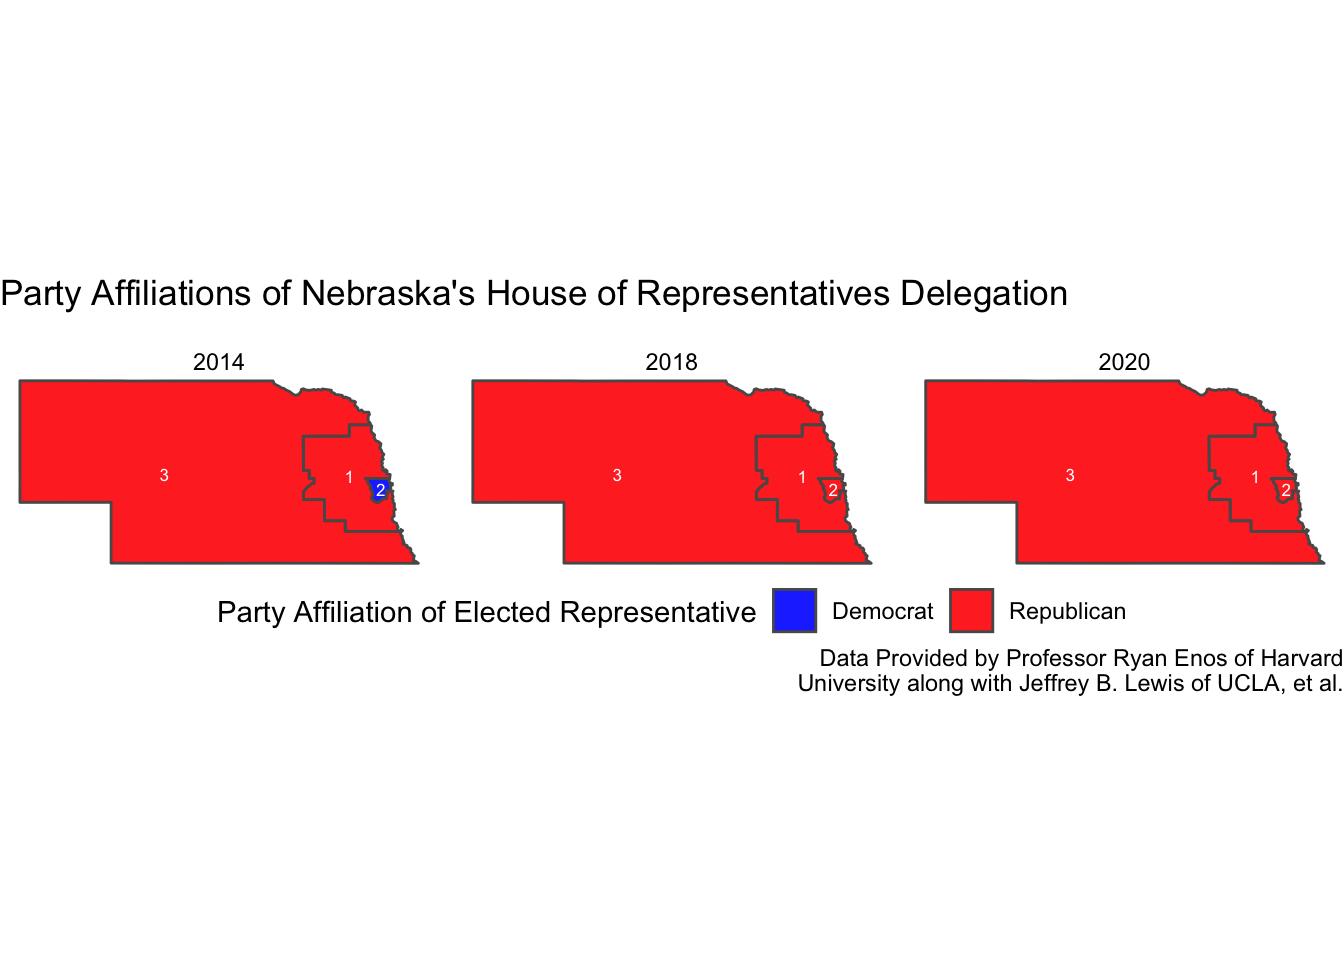
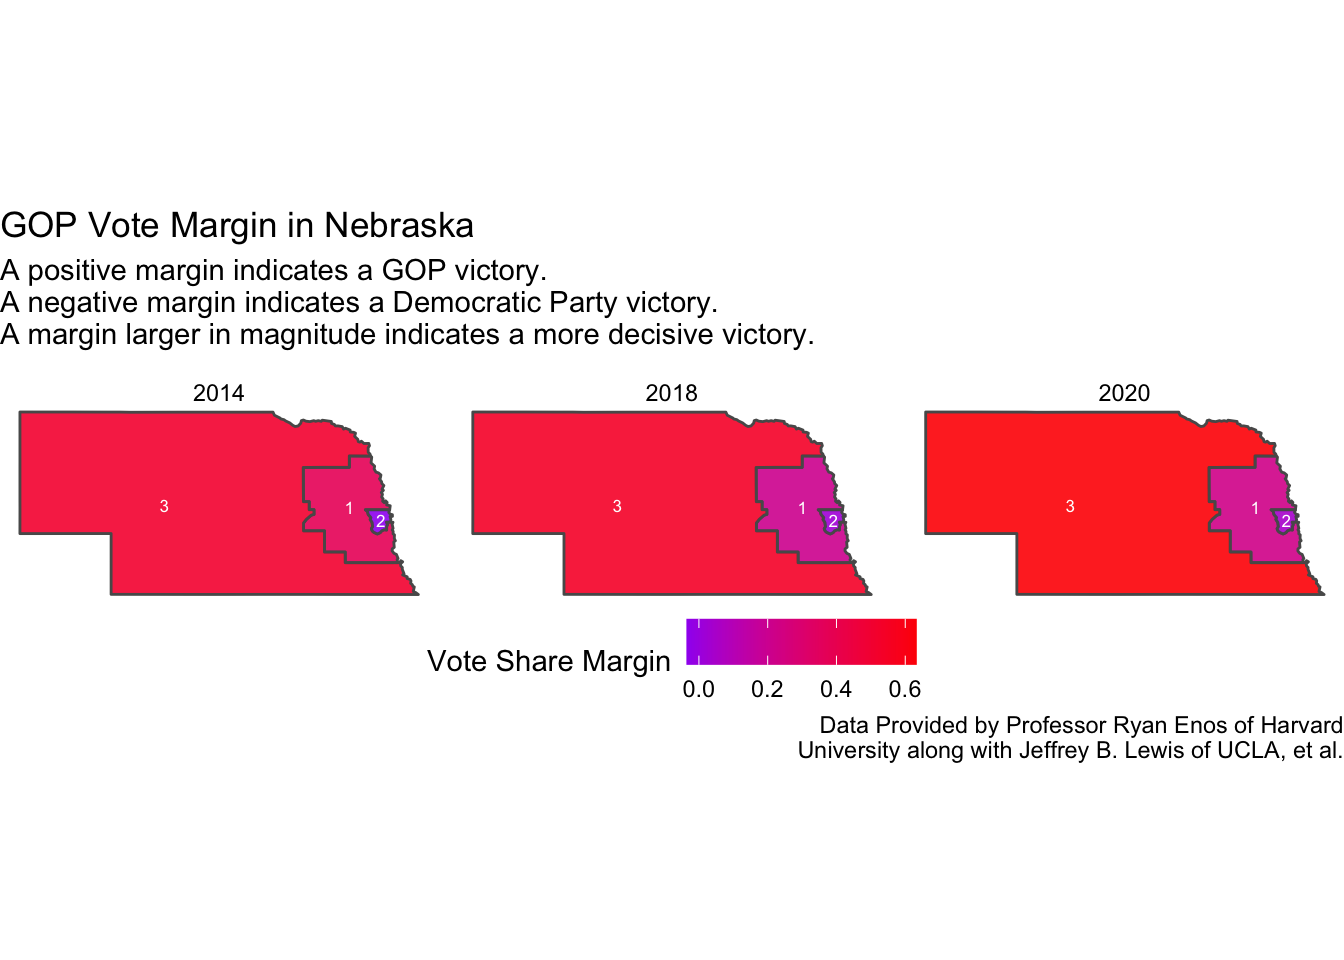
The culmination of my work over the next two months will result in a prediction of the election in Nebraska’s 2nd Congressional District (NE-02). Thus, I would like to discuss Nebraska particular situation regarding vote share margins and seat shares. In the visualizations below, I have included data from 2014 (to compare to those above), 2018 (the most recent midterm election), and 2020 (the most recent voting data).
As of recently, Nebraska has garnered a public reputation of being a dependable state for the GOP. In the visualizations below, it is not hard to understand why that is — especially when Nebraska has had 2 Republican senators throughout this time period as well. However, just under a decade ago, Nebraska had a Democratic senator, and as the visualization displays, a Democratic representative from NE-02. In this district lies Nebraska’s foremost urban city, Omaha, and its sprawling suburbs, an environment becoming increasingly favorable to Democrats nationwide. While NE-02’s Democratic elected official only lasted one term in office after his election in 2014, this phenomenon proved once more that there is potential for a Democrat to emerge from Nebraska.
Nebraska’s Urban-Rural Divide
A common sight across the United States is how rural areas are sprinting toward the GOP while the urban and suburban spheres are huddling around the Democratic Party. In Nebraska, that seems to ring true, according to their vote share margin trends. In NE-01 lies Nebraska’s capital city, Lincoln, with around 300,000 people. The vast majority of Nebraska’s rural land constitutes NE-03, which presents an interesting case of gerrymandering, where this district’s trend of an increasing GOP vote share margin almost guarantees a GOP win each cycle.
A look into NE-01 shows a suprisingly rapid realignment in favor of the Democratic Party: almost cutting in half their 40 point margin deficit in 4 years. This still leaves the district with a 2 election streak of a GOP victory by more than 20 points, signifying that a Republican still ought to be heavily favored solely on party affiliation.
NE-02 is where promise shows for Nebraskan Democrats. In addition to winning in 2014, the Democrats were able to sustain their close competition in the district over the next 6 years, eventually delivering one electoral vote to now-President Joe Biden. By looking into NE-02’s history with their representative’s party affiliation and vote share margins, it is not at all evident that one party is overly favored to win this district every two years. While that is not a prediction in favor of any one party or candidate, it does help to rule out the phenomenon of “one party rule” that has infected many districts across the country. Through this data analysis, I am led to believe that this district contains a competitiveness that gives a Democrat in Nebraska a real avenue toward a groundbreaking win. In the currnet political environment that revolves around an unpopular incumbent Democratic president in his fist term, a struggling economy, and abortion rights, this district will be a fantastic way to learn about how voters behave.
Sources:
Jeffrey B. Lewis, Brandon DeVine, Lincoln Pitcher, and Kenneth C. Martis. (2013) Digital Boundary Definitions of United States Congressional Districts, 1789-2012. Retrieved from https://cdmaps.polisci.ucla.edu on [09-15-2022].
House general elections, All States, 2014 summary. (2022). CQ voting and elections collection (web site). http://library.cqpress.com.ezp-prod1.hul.harvard.edu/elections/avg2014-3us1