In this blog, I have produced my final prediction for the upcoming Fall 2022 Midterm Elections. After exploring potential variables that can influence my predictions for how Democrats will fare and refining those variables, I have finalized my current models for the national-level prediction and the district-level predictions. First, I will explain how my models work, and I will justify why I included the variables that have been inputted. Next, I will interpret how my models perform and put them through a test to validate their effectiveness. Lastly, I will plot and display my predictions and their predicted ranges.
My Predictive Variables
Below, I am going to list my predictive variables and the reasons for which I am using them. In each model that I will examine subsequently, not all of these variables will be used, and I will discuss those reasons when I arrive at that model.
Incumbency
I have two variations for this variable:
- On a national-level model, I will use the total number of incumbents running for re-election for the House of Representatives.
- On a district level model, I will denote whether or not the incumbent is running for re-election in the specific district.
This variable can be a crucial predictor, as I have examined in a previous blog post and as Professor Ryan D. Enos has explored in Gov 1347 Lecture, because incumbents who decide to run for re-election only lose about 5% of the time. This has proven to be a great predictor of victory for an incumbent.
Party Control of the House of Representatives
With political experts floating the notion that undesirable governing outcomes (like high inflation) motivate voters to eject the party in power, I included a variable that indicates what happens to the vote share or seat share when the Democrats hold the House in an election.
Party Control of the White House
In the same vein, I have included a variable that affects vote share or seat share when a Democrat holds the keys to 1600 Pennsylvania Avenue. After all, research shows that many voters tend to punish the incumbent president’s party when they feel he has not performed the job well.
Whether or Not There is a Presidential Election
Here I control for whether the congressional elections are accompanied by a presidential election. I have explored in a previous blog post that if it is a midterm cycle (no accompanying presidential election), vote share and seat shares can be drastically affected.
Mean Democratic Party National Generic Ballot Margin
Here is an interesting variable that accounts for two factors I explored in my polling blogpost:
- Voters hold a recency bias
- Aggregate polls perform better than standalone polls that contain potential bias toward one side
Therefore, I have created a variable that contains an aggregate mean of all generic ballot (Democrats vs Republicans on a nationwide level) polls conducted within 50 days of an election. Assuming the polls are accurate and predictive, this variable factors that people vote on their recent feelings (also giving enough time to account for people voting early) and that polling aggregates converge on the actual result as you get closer to an election. Thus, I employed RealClearPolitics’ Current Aggregated Generic Congressional Ballot, where Democrats are down 2.5 points to the Republicans.
Expert Ratings (Only for District Model)
Lastly, I have included an aggregate mean (for the same reasons above: eliminate bias and wisdom of the crowd) of the expert ratings from various professional outlets: FiveThirtyEight, Cook Political Report, and Inside Elections.. As we will see, these ratings on whether a district is noncompetitive or a toss-up between the different parties are potent predictors. However, some of these ratings are also based off variable I have used above and off fundamental indicators (like the economy), so maybe it is cheating. However, I believe it makes my model more robust, which is the goal. Always have to use your resources, am I right?
National Predictions
The first models that this blog post will examine are forecasting on a national scale. Here I will be using previously explored variables that serve as predictors for the Democratic Party’s vote share and seat share in the coming election. When predicting vote share specifically, I am using a simple unbounded linear regression model, as opposed to a GLM model that keeps the prediction between 0 and 1 (resembling 0% and 100%). In the past, I have used a GLM model, mainly because I was receiving predictions below 0% and above 100% with my linear model. However, my model has improved greatly since then, outputting predictions in-line with previous data and current forecasts by professional outlets, like FiveThirtyEight.
National Democratic Party Vote Share Model
| Dem Votes Major Percent All | |||
|---|---|---|---|
| Predictors | Estimates | CI | p |
| (Intercept) | 51.19 | 42.24 – 60.13 | <0.001 |
| democratic president | -1.90 | -2.93 – -0.87 | 0.001 |
| midterm election | -0.46 | -1.45 – 0.52 | 0.346 |
| previous voteshare | -0.01 | -0.19 – 0.16 | 0.875 |
| mean dem natl gb margin | 0.31 | 0.24 – 0.39 | <0.001 |
| Observations | 35 | ||
| R2 / R2 adjusted | 0.817 / 0.793 | ||
In this model where I predict the Democratic party’s national vote share, the equations follows:
Dem Votes Major Percent = -1.9(democratic president) - 0.46(midterm election) – 0.01(previous voteshare) + 0.31(mean dem natl gb margin) + 51.19
After leaving out some of my other variables that proved to lessen this model’s strength through small predictive capability, it is worth noting how only two variables displayed significance: When the president is a Democrat, the Democratic vote share drops by almost 2 percent and the Democratic vote share increases by 0.31 percent when the Democratic margin on the national generic ballot aggregate increases by 1 percent (which shows how polling tends to overestimate support for the Democrats). The other two variables did not prove significant, as shown by their confidence intervals: Democratic vote share can increase or decrease when it’s a midterm election, and the previous vote share in the last election truly holds no predictive power.
National Democratic Vote Share Prediction
Overall, the Democrats seem to have a very unfavorable environment this cycle, because President Joe Biden is a Democrat and their generic ballot polling margin is 2.5 points below the Republican’s. Below, I show my prediction for the Democratic party vote share on a national level:
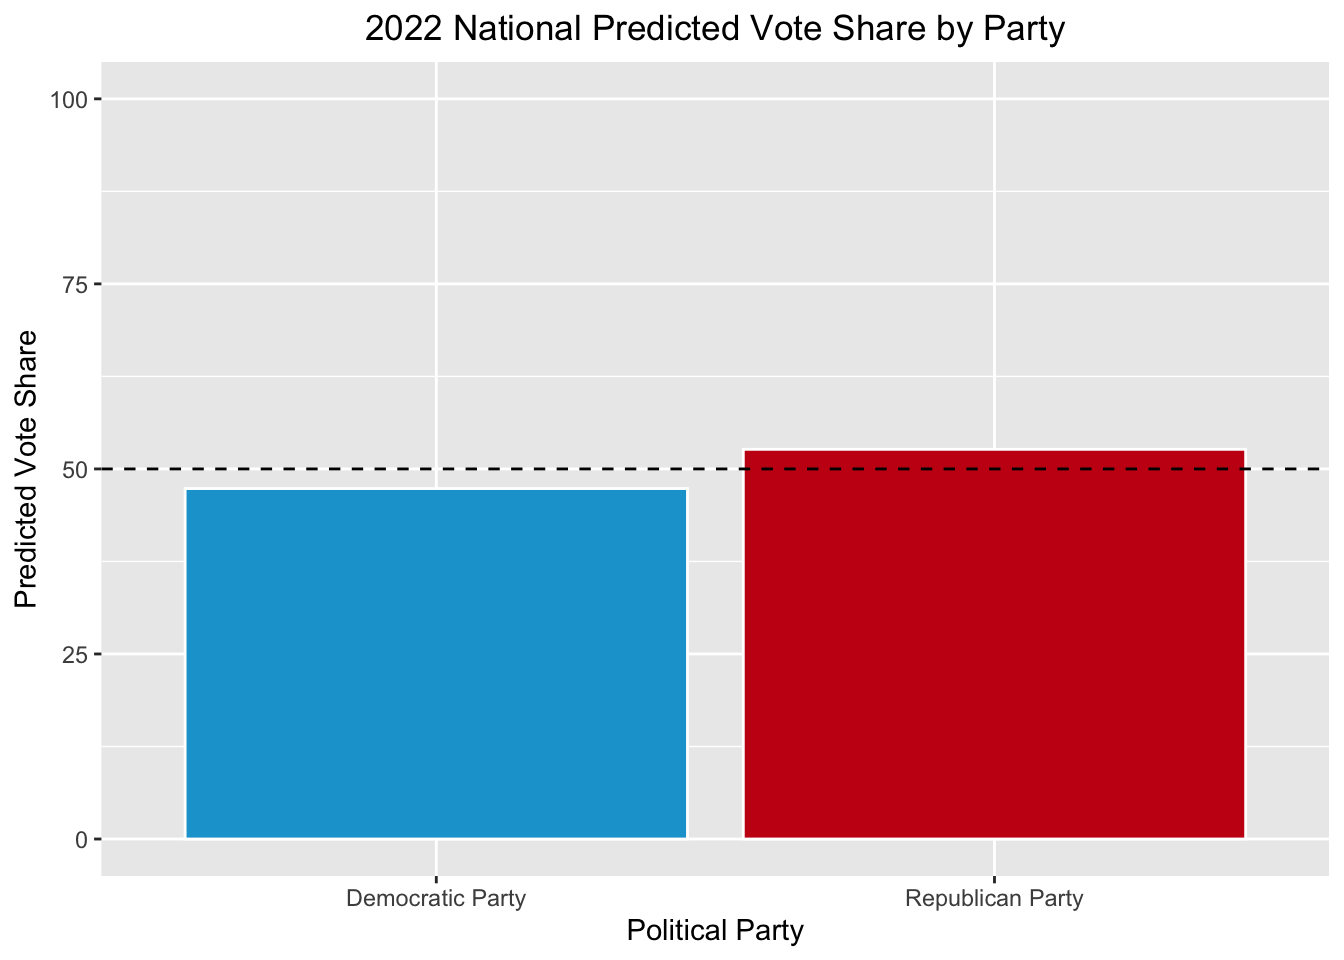
##        fit      lwr      upr
## 1 47.34632 44.24339 50.44925
Overall, we see that my best guess is the Republicans will win with a slight cushion over the Democrats who will receive 47.35% of the vote. However, my interval is somewhat wide, containing an upper bound greater than 50%, meaning that I am 95% confident that the Democrats could still eek out a win.
National Democratic Party Vote Share Model Test
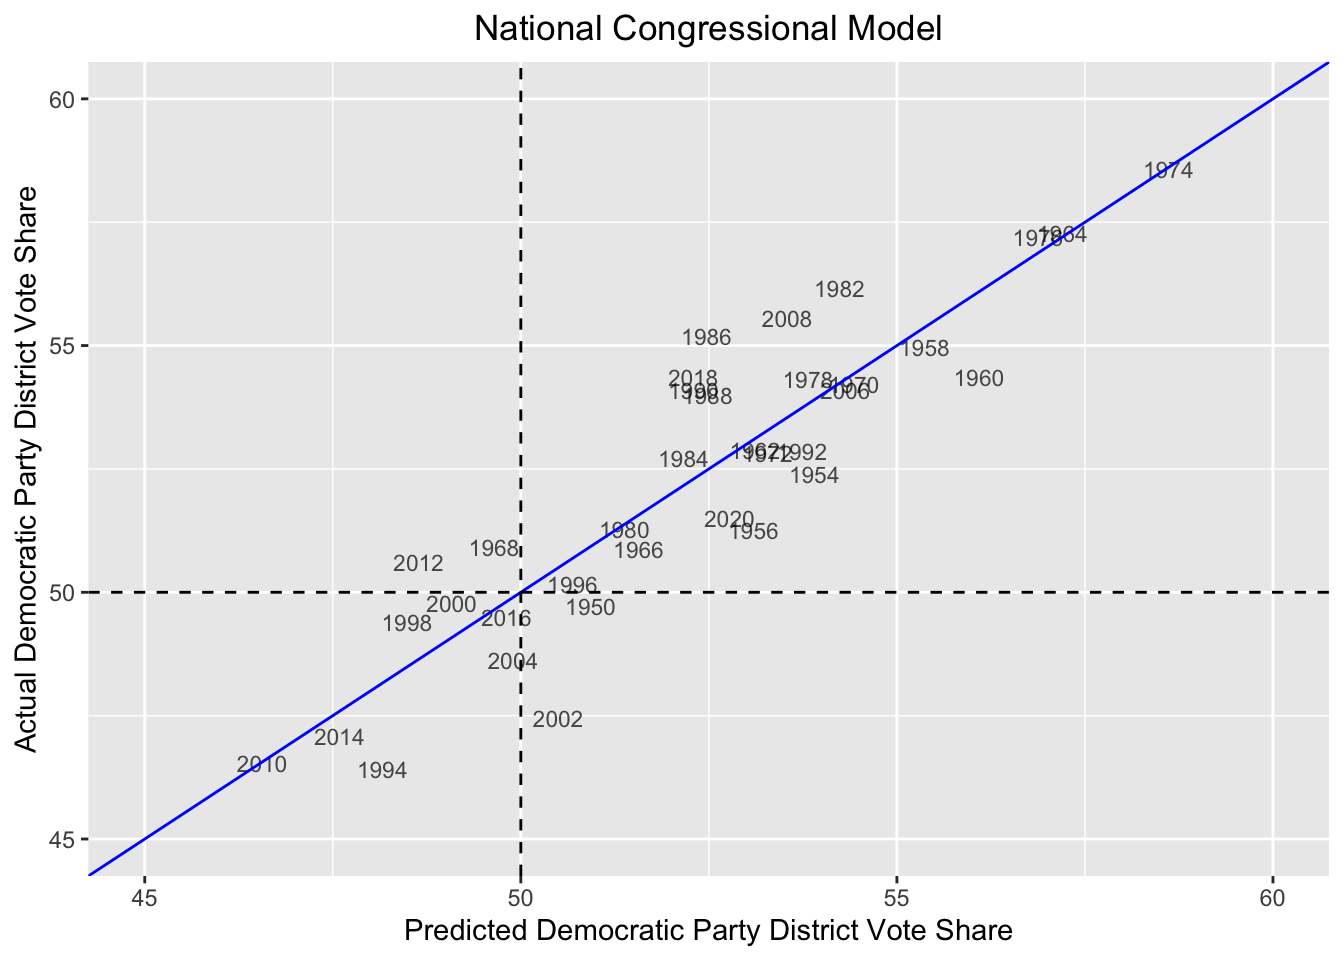
Here I validate this national vote share model, by comparing what my model would have predicted for each observation included in the model and what that cycle’s actual Democratic party vote share was. In the graph below and the model’s high adjusted R-squared (0.793), it is evident this model is highly predictive given the data provided.
Only a few cases where it went wrong are displayed in quadrants II and IV. This is the case for 1950, 1968, 2002, and 2012. However, even this miscalls are not far off the blue 45-degree line, which aligns a prediction with its result. If a cycle falls exactly on this line, as many do, the model predicted the result accurately.
Overall, I am very confident in this model because of its predictive power. However, my wide predictive interval leaves me some unrest.
National Democratic Party Seat Share Model
The real power in governing is when you hold a seat majority, which allows you to set the agenda and pass laws. Getting a majority of the national vote share means little if the party does not get a majority of the seats. This can happen when one party runs up the numbers in some districts, such as winning some districts by 75%+. However, winning a district by 51% effectively no different than by 75%; the party winner only receives one seat. Below, I will now use a linear model to predict the number of seats won by the Democratic Party.
| democratic seats won | |||
|---|---|---|---|
| Predictors | Estimates | CI | p |
| (Intercept) | 207.79 | 107.38 – 308.20 | <0.001 |
| total incumbents | -0.08 | -0.30 – 0.13 | 0.424 |
| democratic house | 13.86 | -3.50 – 31.21 | 0.113 |
| democratic president | -10.37 | -19.17 – -1.58 | 0.022 |
| midterm election | -1.20 | -9.81 – 7.41 | 0.777 |
| previous seatshare | 0.15 | -0.12 – 0.42 | 0.255 |
| mean dem natl gb margin | 2.58 | 1.97 – 3.19 | <0.001 |
| Observations | 35 | ||
| R2 / R2 adjusted | 0.884 / 0.859 | ||
In this model where I predict the Democratic party’s national seat share, the equations follows:
Democratic Seats Won = -0.08(total incumbents) + 13.86(democratic house) - 10.37(democratic president) - 1.20(midterm election) + 0.15(previous voteshare) + 2.58(mean dem natl gb margin) + 207.79
Again, it is worth noting how the same two variables displayed significance: When the president is a Democrat, the Democratic vote share drops by about 10 percent and the Democratic vote share increases by 2.58 percent when the Democratic margin on the national generic ballot aggregate increases by 1 percent (which shows how polling tends to underestimate the Democrats’ resulting seat wins). The other variables did not prove significant, as shown by their confidence intervals: Democratic vote share can increase or decrease when the total number of incumbents running for re-election increases by one, when the Democrats hold the House, when it’s a midterm election, and the previous vote share increases by 1 percent. However, my high adjusted R squared gives me comfort (and some suspicion of overfitting my model to the data).
National Democratic Seat Share Prediction
Below is my prediction for the Democrats’ resulting seat share in the House after the midterm elections, and it does not look great for them, due to their unfavorable environment.
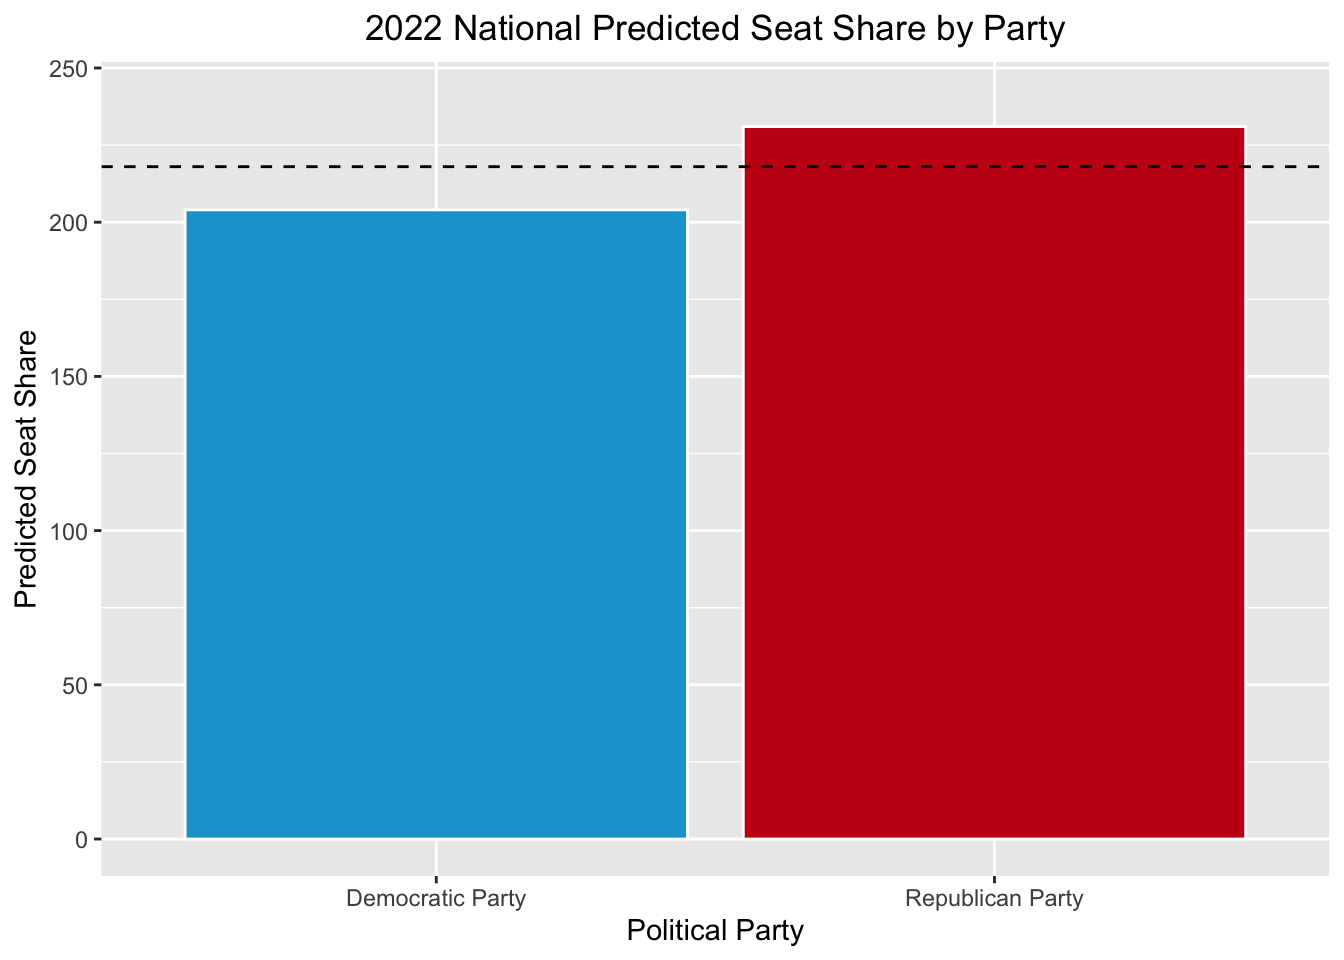
##        fit      lwr      upr
## 1 204.3809 176.5787 232.1831
Once again, I predict the Democrats fall back into the minority with 204 seats, allowing the Republicans to win it back with a total 231 seats. My confidence interval is not ideal, as it shows the Democrats potentially winning as little as 176 seats and as much as 232 seats (which means they would gain seats… and is unlikely).
National Democratic Party Seat Share Model Test
Here, I run the same validation test as I did above for the vote share model: I predict each observation/election cycle with my model as is.

What leaves me feeling satisfied by this model is its sheer accuracy. In every cycle, my model accurately predicts who wins a majority of seats in the House of Representatives. Despite the number of seats won fluctating, the actual winner is predicted with 100% accuracy.
Congressional District Predictions
Next, I will move on to my district-level forecasts. In this model, I am predicted the vote share of the Democratic candidate in their particular district. What is difficult about this model is how variable data can be district-to-district. I explored this phenomenon in a previous blog post, and the crux is that many districts simply are not competitive. Lacking competition often ensures a lack of investment in and attention to the district, since the predicted winner is often known. Therefore, I will continue to use my current variables and input a powerful one: expert ratings.
District Voteshare Prediction Model
I have build another linear model to predict the vote share of the Democratic candidate in their particular district.
| Dem Votes Major Percent | |||
|---|---|---|---|
| Predictors | Estimates | CI | p |
| (Intercept) | 28.76 | 27.43 – 30.10 | <0.001 |
| incumb district | -0.24 | -0.92 – 0.44 | 0.491 |
| democratic house | -4.67 | -5.17 – -4.16 | <0.001 |
| democratic president | -3.30 | -3.79 – -2.80 | <0.001 |
| midterm election | -2.31 | -2.77 – -1.85 | <0.001 |
| previous voteshare | 0.53 | 0.51 – 0.56 | <0.001 |
| total avg rating | 2.09 | 1.98 – 2.20 | <0.001 |
| Observations | 2615 | ||
| R2 / R2 adjusted | 0.887 / 0.887 | ||
The equations follows:
Democratic Candidate Vote Share = -0.24(incumb district) - 4.67(democratic house) - 3.30(democratic president) - 2.31(midterm election) + 0.53(previous voteshare) + 2.09(mean dem natl gb margin) + 28.76
Finally, I have arrived at a model with a whole host of variables with potent predictive power. The only variable lacking predictive power is whether an incumbent is running for re-election, which could increase or decrease the vote share of the Democratic candidate.
However, my model incorporates five variables with high significance:
When the president is a Democrat, the Democratic candidate’s vote share drops by about 3.30 percent
When the election is during a midterm cycle, the Democratic candidate’s vote share drops by about 2.31 percent.
For every 1% increase in the previous vote share, the Democratic candidate’s vote share increases by about 0.53 percent, showing how previous performance is not as indicative of future performance.
When the mean aggregate expert rating increases by 1 (which means a higher win probability for the Democrats), the Democratic candidate’s vote share increases by about 2.09 percent. This is significant since moving from a toss-up district to one that leans Democratic means the candidate will receive about 2 more percentage points.
When the House is held by Democrats, the Democratic candidate’s vote share drops by 4.67 percent. This is the largest coefficient, showing how when there is a Democratic house, a Democratic president, a midterm cycle, a given previous vote share and expert rating, Democratic candidates suffer greatly. Possibly, this shows how voters truly do punish the party in power, especially during a President’s midterm cycle.
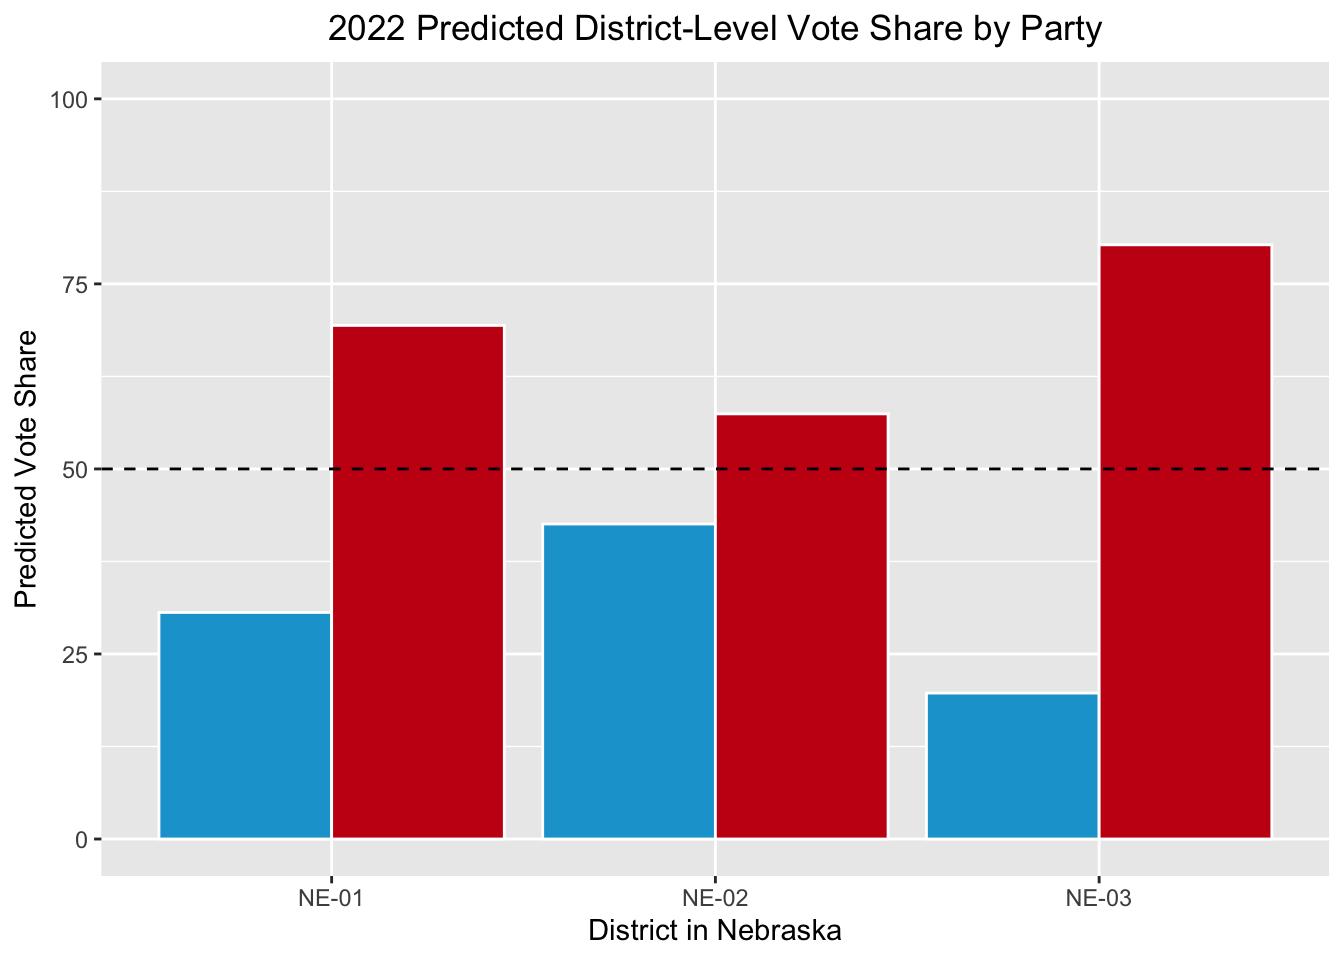
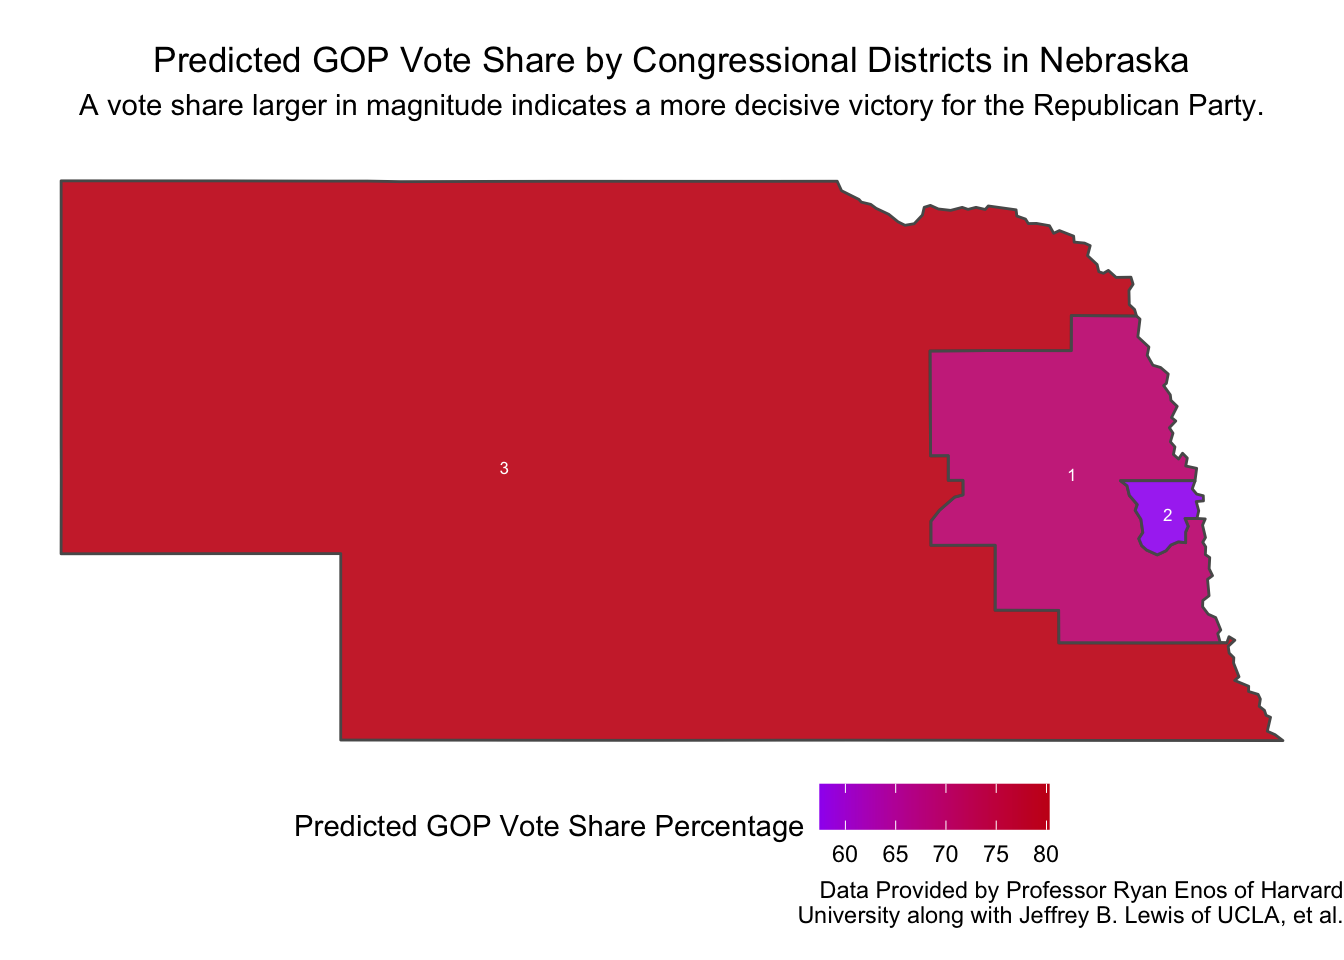
Nebraska Democratic Voteshare by District
This blog is focused around the three congressional districts in Nebraska, where two are not regarded as competitive, NE-01 and NE-03, and the other, NE-02, still hangs in the balance, with no outcome certainly likely.
With the extremely unfavorable environment in which Democrats find themselves, my predictions do not fare well for them. Below are my predictions:
District Model Test
Once again, I will validate this model by seeing how predictive it is with regard to the thousands of districts that inform it.
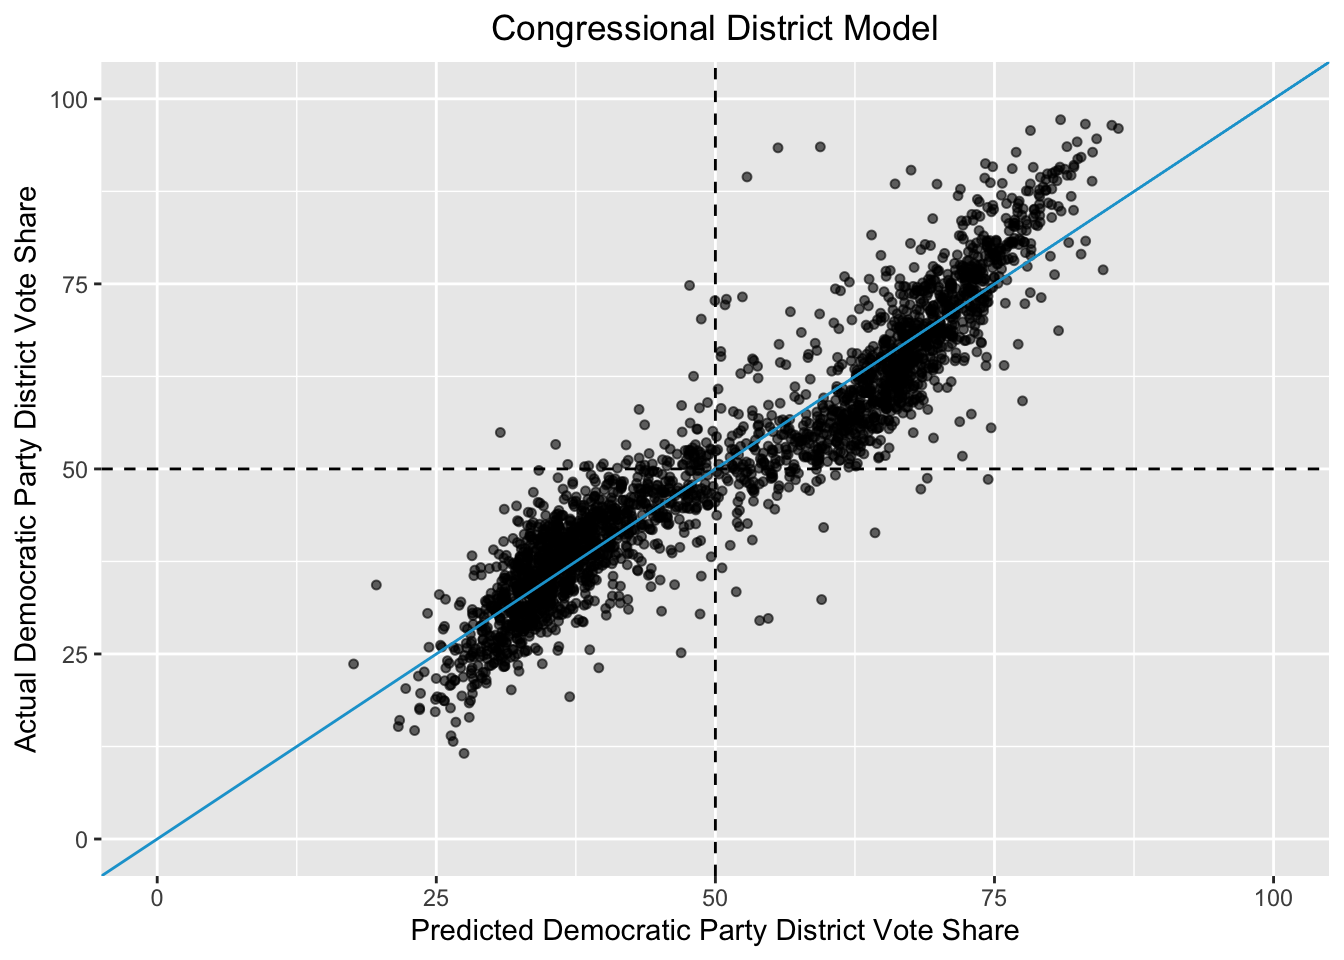
In the plot above, one can see that my model is highly predictive, rarely miscalling a winner. When predicting each district as if its result was unknown, we can see my model often not only gets the winner correct, but it also closely follows the blue line, which shows an accurate prediction (points above show an underestimation, and points below show an overestimation). With this robustness and high adjusted R-squared of 0.887, I am confident this model is highly predictive.
Limitations
In each blog post, I have included a section on the limitations of my models, always commenting on how some variables may not be as great of predictors as one might think. However, in this section, I will take a brief and more “big picture” view.
In these models, I chose to include more national-level variables because they were more widely available and reliable than shaky data district-to-district. This allowed for me to include many more observations in my models, national and district, than I would have been able to. However, it limits the extent to which I can differentiate each district’s predictions, since national variables are the same for each district in a given cycle. Nonetheless, I believe my aggregate expert ratings and previous vote share are powerful.
Also, my model’s uncertainty in their predictions should cause some worry. Especially for the national Democratic seat share model, my prediction intervals are too wide. However, this may simply be something one has to expect in a model with only 35 observations. America is a young and unique country, and thus there are only so many elections from which to draw data. Thus, forecasting does its best to learn about voters with the data it has.
Final Nebraska Congressional District Map
To conclude this prediction blog, I will end with how I started this website: a map of my predictions for each of Nebraska’s three congressional districts. Surely enough, my predictions follow the trend of Republicans holding their ground.
Notes:
This blog is the last of a series of articles meant to progressively understand how election data can be used to predict future outcomes. I have added to this site on a weekly basis under the direction of Professor Ryan D. Enos. Tomorrow, on November 8, 2022, the midterm elections will be held. In this post, I haved used all I have learned regarding what best forecasts election results to predict the outcome of the NE-02 U.S. Congressional Election.